Abacavir
vs. Nelfinavir & Preliminary Data on Abacavir
This is
a preliminary 24-week report of a 48-week open-label study comparing abacavir to
nelfinavir 750 mg three times per day. The study is to assess safety and
tolerance (including metabolic complications). The primary endpoint of the study
is the percentage of patients with HIV RNA <50 copies/ml at week 48.
Individuals with viral load between 1000 - 500,000 copies/ml are eligible. There
are 98 patients in the abacavir arm and 97 in the nelfinavir arm. The study had
3 analyses: (1) ITT Switch Included; switch of randomized medication not
included as failure; (2) ITT Switch=Failure; failure is changed or permanently
off randomized study medication, missing data, plasma HIV RNA >50 copies/ml,
HIV RNA >400 copies/ml; (3) As Treated (AT): on treatment. Median baseline
viral load was the same in both arms; 4.2 log (15,000 copies/ml) (range
1.3-5.3). Median baseline CD4s were 387 in abacavir arm and 449 in nelfinavir
arm.
Patient
Disposition. In
the abacavir arm, 87 patients completed 24 weeks, 77 did not switch, 10 did
switch, and 9 discontinued randomized treatment. In the nelfinavir arm, 83
patients completed 24 weeks, 74 did not switch therapy, 9 switched, and 9
discontinued randomized treatment. Of the 19 in the abacavir arm that made a
treatment change, 13 were due to an adverse event, 5 withdrew consent, and 1
other. In the nelfinavir arm, there were 18 who changed their treatment: 11 due
to adverse event, 2 withdrew consent and 5 other.
Viral
Load Suppresion.
At week 24, 77% of the patients in the abacavir arm and 72% in the nelfinavir
arm had <50 copies/ml (ITT Switch=Included). Using the ITT Switch=Failure
analysis, 67% in the abacavir arm, and 66% in the nelfinavir arm had <50
copies/ml. Using the As Treated analysis, 90% (n=72) in the abacavir arm and 86%
(n=70) in the nelfinavir arm had <50 copies/ml. Both arms had a median viral
load reduction of about 2.4 log at week 24. The median CD4 change was about +90
in the abacavir arm and +65 in the nelfinavir arm at week 24.
Safety
and Tolerance. 62%
of patients (110/188) had ≥1 adverse event. The most frequent (≥10%)
drug related AEs were: nausea & vomiting 38% (n=36) in the abacavir arm, and
32% (n=29) in the nelfinavir arm; diarrhea; 7% (7) in the abacavir arm and 41%
(38) in the nelfinavir arm. 5% (9/188) had ≥1serious adverse events; there
were 4 abacavir hypersensitivity reactions reported (4%). Early discontinuation
of at least one study drug: 13 (14%) in abacavir arm, 11 (12%) in the nelfinavir
arm. There was one serious AE in the nelfinavir arm, and none in abacavir arm.
Comments:
The baseline viral load was very low (4.2 log).
Abacavir
versus Indinavir in Combination with Combivir (AZT/3TC) in Therapy NaÔve
(CNA3014): patient group with baseline viral load >100,000 copies/ml.
This is an open-label, randomized, multi-center 48-week study and Pedro Cahn
from Buenos Aires reported preliminary 24 week data. The viral load endpoint is
400 copies/ml. The study looks at adherence, safety, tolerability, and
"satisfaction". Patients have an option of switching therapy after
week 16, if 2 consecutive viral loads are >400 copies/ml. For study entry,
patients must have viral >5000 copies/ml and are stratified to viral load
>5000 to 100,000 or >100,000. 342 treatment-naÔve individuals were
randomized to receive abacavir/combivir (n=169) or indinavir/combivir (n=173).
The two analyses used are Intent-To-Treat (Missing=Failure) ITT: all subjects
taking at least 1 dose of study treatment; As Treated (AT): all subjects while
on randomized treatment, with the exception of major protocol violators
(pregnancy or non-adherence; cumulative total of >6 weeks or continuous of
>2 weeks).
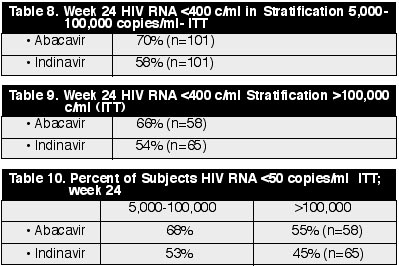
There
were about 60% men in each arm. Baseline median viral load was 4.8 in each arm
(63,000 copies/ml). 64% in the abacavir arm and 62% in the indinavir arm were
stratified to the 5,000-100,000 copies/ml group (n=216). 36% in the abacavir arm
and 38% in the indinavir arm were stratified to the >100,000 copies/ml arm
(n=126). CD4s at baseline were 323 in abacavir arm and 300 in the indinavir arm.
5 in the abacavir arm and 7 in the IDV arm did not start therapy. There were 14
(8%) discontinuations in the abacavir arm and 21 (12%) in the indinavir arm.
Total subjects who changed therapy prior to week 24: 29 (18%) in the ABC arm,
and 45 (27%) in the IDV arm. Here is the breakdown: those who switched therapy
due to viral load >400 copies/ml; 4 in ABC arm and 15 in the IDV arm. Adverse
event or lab abnormality: 6 in ABC arm and 7 in IDV arm. Listed as other reasons
for switch of therapy: 17 in ABC arm, 23 in IDV arm. Overall, using the As
Treated analysis, 87% in the ABC arm had <400 copies/ml and 83% had <400
copies/ml in the IDV arm. Over 100 were in each of these analyses. (See
Tables 8, 9 & 10)
CD4s
increased about the same in both groups; 110.
Adherence
at Week 24:
Took
all doses: 58% in ABC, 25% in IDV arms
Took
all doses or missed <1 dose per week: 74% in ABC and 45% in IDV arms.
Summary
of Adverse Events:
Any
drug related AE: 59% in ABC and 75% in IDV arms
Any
grade 3/4 AE: 4% in ABC and 12% in IDV arms
ABC
hypersensitivity: 6%
AE
resulting in study drug discontinuation: 9% in ABC and 10% in IDV arms.
Comments:
It appears as though adherence and adverse events play a crucial role in the
study. While
indinavir is probably more potent than abacavir, abacavir is easier to adhere to
and is probably more tolerable. This is attested to by the data in this study
showing less adherence and more adverse events in the indinavir arm.