 |
|
|
| |
Tipranavir 48 weeks (RESIST Studies): efficacy & safety
|
| |
| |
Reported by Jules Levin
EACS, Dublin, Nov 2005
"RESIST-1 (R-1) and RESIST-2 (R-2): 48 week
meta-analyses demonstrate superiority of protease inhibitor (PI) tipranavir+ritonavir (TPV/r) over an optimized comparator PI (CPI/r) regimen in antiretroviral (ARV) experienced patients"
Cahn, P1 and Hicks, C2 for the RESIST-2 and RESIST-1 Study Teams
Fundación Huesped, Buenos Aires, Argentina; 2. Duke University, Durham, NC, USA
Abstract
Background: TPV is a PI with potent activity against resistant HIV-1. R-1 and R-2 are two open label phase 3 trials that compared TPV/r with CPI/r in ARV experienced patients. 48-week results of the combined trials are presented.
Methods:
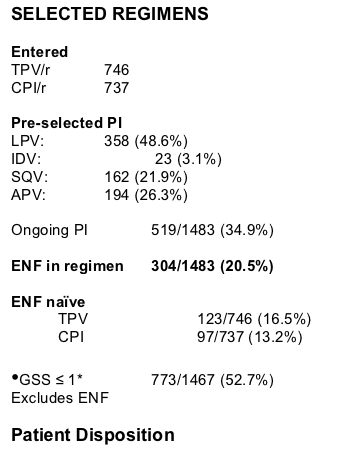
--Patients had 3 or more class ARV experience,
--2 or more previous PI-based regimens,
--1 or more primary PI mutation: viral isolate carrying ≥1 primary protease mutation at 30N, 46I/L, 48V, 50V, 82A/F/L/T, 84V, 90M
--and <3 mutations among 33, 82, 84 and 90.
--Optimized CPI/r and background regimens (could include ENF) were
selected, pre-randomization.
Primary efficacy endpoints were treatment response (TR, confirmed 1 or more log10 VL decrease) and time to treatment failure (TTF).
Similar designs, demographics and responses in R-1 and R-2 justify a combined trial meta-analysis.
Results: 620 patients were randomized in R-1 (N America, Australia) and 863 in R-2 (Europe, Latin America). Baseline (BL) characteristics were similar across trials and between treatment groups. BL isolates had 3 primary PI mutations
(median). Prior ARVs received were 4/6/1 (medians) for PIs/NRTIs/NNRTIs.
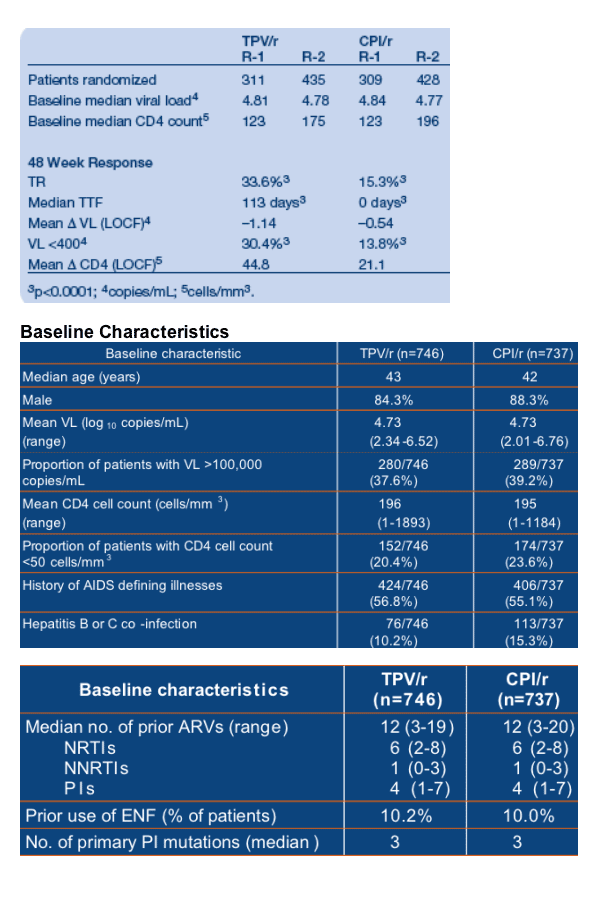
TPV/r was significantly more potent compared to CPI/r. ENF enhanced 48 week responses: TR was 48.5% vs 20.0%; TTF was 337 vs 0 days for ENF+TPV/r and
ENF+CPI/r. Adverse events were similar for both studies. Exposure-adjusted SAEs for TPV/r and CPI/r were 23.9 and 27.8/100 patient-years, respectively. Deaths were 2.4 and 2.8/100 patient-years. TPV/r had higher rates of ALT and lipid elevations than CPI/r.
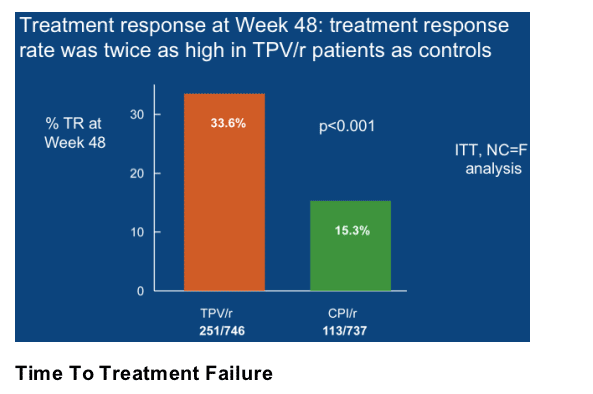
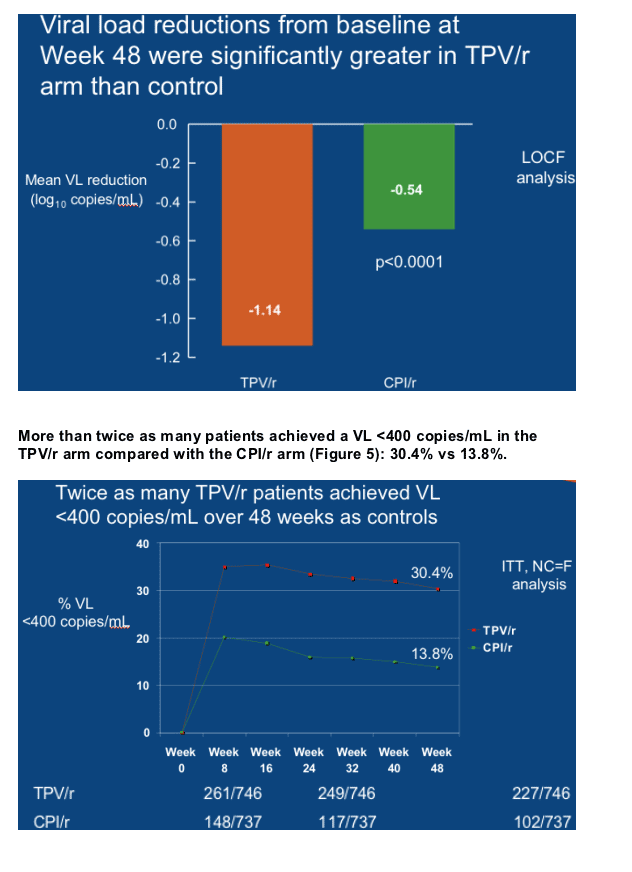
Twice as many TPV/r patients achieved a treatment
response at Week 48 as control patients
Patients taking TPV/r were twice as likely to experience a TR at Week 48 as those taking a CPI/r. The TR rate was 33.6% (251/746) in the TPV/r arm and 15.3% (113/737) in the CPI/r arm (p<0.001) (Figure 2). The TR was 48.5%
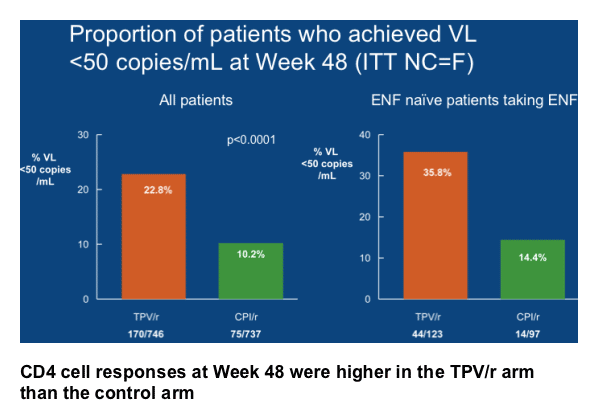
(82/169) in patients who took TPV/r plus an OBR that contained at least one active ARV, e.g. ENF, but it was 20.0% (27/135) in patients who took CPI/r plus ENF.
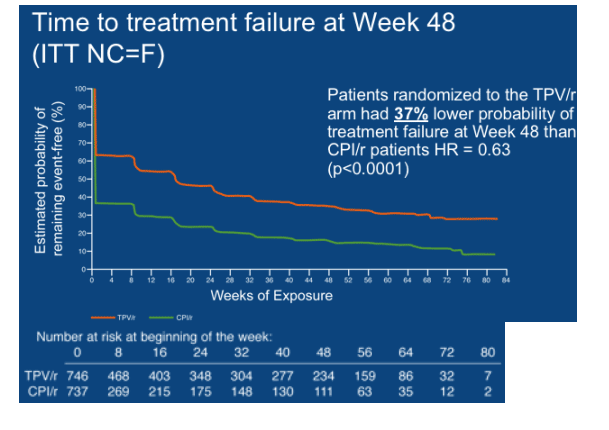
The median time to treatment failure (TTF) was 113 days in the overall TPV/r group and 0 days in the CPI/r group (p<0.0001) (Figure 3). The median TTF was 0 days in the control group because <50% of the control patients achieved a virologic response in the RESIST studies, even though they were taking a standard of care PI/r plus an OBR. Patients randomized to the TPV/r arm had a 37% lower probability of treatment failure than those randomized to a CPI/r (HR = 0.63, p<0.0001).
Including an active ARV in the OBR, such as ENF, increased the median TTF to 337 days in the TPV/r arm but the TTF was unchanged in the CPI/r arm in patients who took ENF (0 days) (p<0.0001).
At Week 48, mean CD4 cell counts had increased by 45 cells/mm3 in patients taking TPV/r and by 21 cells/mm3 in the control patients (Last Observation
Carried Forward [LOCF]).
Safety
Exposure-adjusted serious adverse events (SAEs) for TPV/r and CPI/r were 23.9 and 27.8/100 patient-years, respectively. More patients in the TPV/r arm experienced Grade 3/4 alanine aminotransferase (ALT) and total cholesterol elevations than those in the control arm: 9.7% and 4.2% in the TPV/r arm and 2.1% and 0.4% in the CPI/r arm, respectively. Grade 3/4 triglyceride levels were
observed in 24.9% of TPV/r patients and 13.0% of control patients. TPV/r has a similar safety profile to the CPIs/r studied in RESIST, with two exceptions - elevations in liver enzyme and lipid levels.
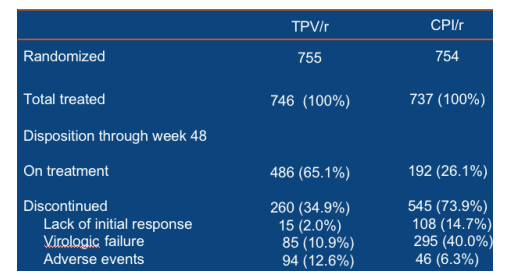
Discontinuation of study medication due to adverse events (per 100 patient-years): 12.4 for TPV/r, 10.6 for CPI/r. Deaths per 100 patient-years: (majority of patients had advanced HIV disease and died due to AIDS-related causes rather than therapy): 2.4 for TPV/r, 2.8 for CPI/r.
The patient population enrolled in the RESIST studies had advanced HIV disease and, as a result, many had a poor prognosis. The death rates were similar in both arms: 2.4 and 2.8/100 patient-years (adjusted for exposure),
respectively in the TPV/r and CPI/r arms.
|
|
| |
| |
|
|
|
|
|