 |
 |
 |
| |
Once Daily Fosamprenavir/RTV 1400/100mg + FD ABC/3TC Pilot study
|
| |
| |
Reported by Jules Levin
Glasgow, Nov 12-16, 2006
"Once-Daily Fosamprenavir (FPV) with a Reduced Dose of Ritonavir (RTV),
Given with Fixed-Dose Abacavir (ABC)/Lamivudine (3TC):
A Planned Week 24 Interim Analysis"
C Hicks1, E DeJesus2, L Sloan3, M Sension4, D Wohl5, Q Liao6, I Gray6, K Pappa6 and T Lancaster6.
1Duke Univ, NC; 2Orlando Immunology Ctr, FL; 3N Texas Inf Disease Consultants, TX; 4Comprehensive Care Ctr, FL; 5UNC Chapel Hill, NC and 6GlaxoSmithKline, NC.
Introduction
In 2006, IAS Treatment Guidelines expanded the recommended regimens for initial therapy to include boosted PIs + 2NRTIs.
The Once-daily (QD) FPV/r dose used most frequently is 1400mg FPV + 200mg RTV for naive patients.
This study (COL100758) compared FPV/r 1400mg QD boosted with low-dose RTV (100mg) (FPV/r-100) to FPV 1400mg QD + RTV 200mg QD (FPV/r-200).
One reason for studying the lower 100mg RTV boosting dose is to assess the impact of lower-dose ritonavir on metabolic changes including changes in lipids, glucose, insulin and fat redistribution.1
When FPV/r 1400/200 QD was compared to FPV/r 1400/100 QD in COL10053, plasma amprenavir trough levels were 38% lower in the FPV/r 1400/100 arm but remained above the historical mean APV protein binding (90%) adjusted IC50 for wild-type HIV-1.
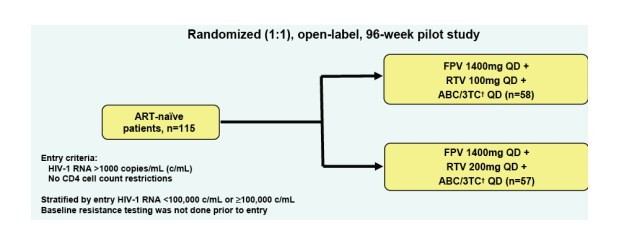
Figure 2. Study Design of REDUCE
115 ART-naive patients randomized 1:1 open-label in 96-week pilot study to FPV 1400mg QD + RTV 100mg QD + ABC/3TC QD (n=58) or to FPV 1400mg QD + RTV 200mg QD + ABC/3TC QD (n=57). Abacavir/3TC given as a fixed dose combination tablet.
Endpoints
Primary
Proportion of patients with plasma HIV-1 RNA <400 c/mL at 48 weeks
Proportion of patients who experience drug-related discontinuations by Week 48
Secondary
-- Proportion of patients who achieve plasma HIV-1 RNA <400 c/mL at Weeks 24 and 96.
-- Proportion of patients who achieve plasma HIV-1 RNA <50 c/mL at Weeks 24, 48, and 96.
-- Absolute values and change from baseline in plasma HIV-1 RNA and CD4+ cell counts at Weeks 24, 48, and 96.
-- Development and identification of genotypic resistance mutations and phenotypic resistance at virologic failure.
-- Incidence of Grades 2 to 4 AEs, treatment-limiting AEs, and serious adverse events (SAEs) over 24, 48, and 96 weeks.
-- Change from baseline in fat distribution as determined by percent change in body fat using whole body DEXA scans at Weeks 48, 72, and 96.
-- Change from baseline in patient's self-report of body fat distribution and the investigator's assessment of patient's body fat distribution using FRAM 2 PE at Weeks 48, 72, and 96.
-- Change from baseline in fasting lipids, fasting glucose and insulin measurements at Weeks 12, 24, 48, and 96.
-- Measurements of plasma APV trough concentrations at Weeks 4, 8, 24, and 48
RESULTS
Baseline Characteristics
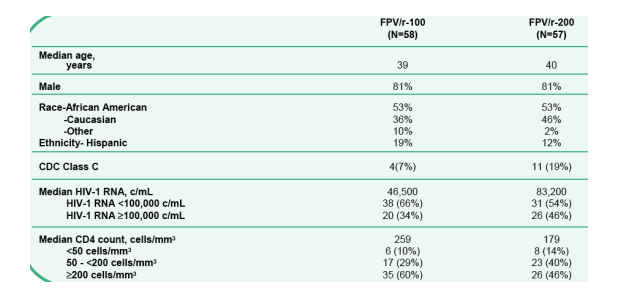
53% African-American; 12-19% Hispanic. 34-46% >100,000 c/ml. 10-14% <50 CD4; 29-40% 50 to 200 CD4.
Completion Status at 24 Weeks
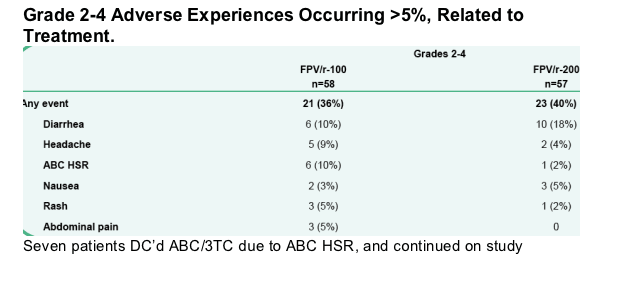
90% have completed 24 weeks, 10% have prematurely withdrawn. Primary reasons for withdrawal: 1% viral failure; 3% AE.

-- One patient DC'd study due to AE while on FPV/r-100 due to new onset Type II DM
-- Two patients DC'd study due to AE while on FPV/r-200 due to Grade 2 Rash
-- All patients prematurely withdrawn from the study for any reason were considered failures in the Intent-to-Treat, Missing=Failure (M=F) analysis
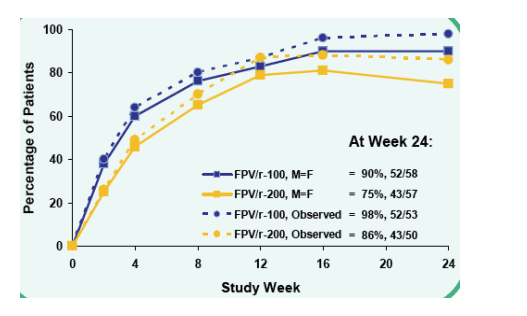
HIV-1 RNA <400 c/mL at Week 24
FPV/r-100, M=F: 90% 52/58
FPV/r-200, M=F: 75%, 43/57
Observed: 98% (52/53) FPV/r-100; 86% (43/50) FPV/r-200
p-values at Week 24 were 0.051 for M=F analysis and 0.027 for Observed analysis
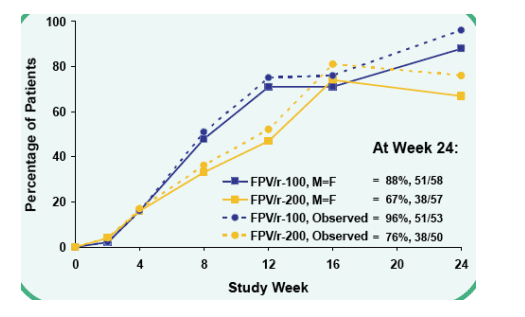
HIV-1 RNA <50 c/mL at Week 24
FPV/r-100, M=F: 88%, 51/58
FPV/r-200, M=F: 67%, 38/57
Observed: FPV/r-100 96% (51/53); FPV/r-200 76% (38/50)
p-values at Week 24 were 0.009 for M=F analysis and 0.004 for Observed analysis
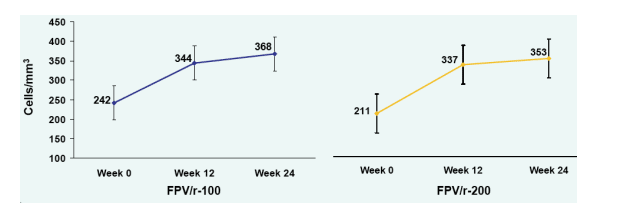
Mean CD4+ Cell Count with 95% Confidence Intervals at Week 24
CD4 increased 126 cells in FPV/r-100 from 242 to 368, and 152 cells in FPV/r-200 from 211 to 363.
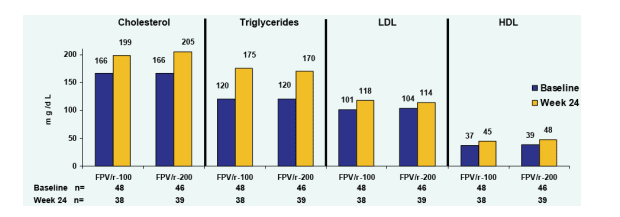
Median Fasting Lipids at Baseline and Week 24
Lipid changes were about the same in each group at baseline and at week 24.
FPV/r-100: chol, 166 at baseline, 199 at wk 24; TG, 120 at baseline, 175 at week 24; LDL, 101 at baseline, 118 at wk 24; HDL: 37 at baseline, 45 at wk 24.
Summary of GFR Changes for All Patients
MDRD GFR Category (mL/min): <30 - 0% at baseline, 0% at week 24;
30 - <60: 3% at baseline, 0% at week 24.
60 - <90: 50% at baseline, 45% at week 24.
>/= 90: 47% at baseline, 55% at week 24.

Preliminary Adherence Measurements
Patient medication adherence to ABC/3TC and RTV (using mean pill count data) was higher in the FPV/r-100 arm. Adherence to FPV was similar.
Preliminary mean plasma APV trough concentrations for both treatment arms were consistent with those observed in COL10053.
|
| |
|
 |
 |
|
|