 |
 |
 |
| |
Efficacy and Safety Results of Darunavir/ritonavir in Treatment-experienced Patients: POWER 3
|
| |
| |
Reported by Jules Levin
Poster 957. IDSA, Oct 12-15, 2006, Toronto
Michael Saag, MD1; Ron Falcon, MD2; Eric Lefebvre, MD3
1UAB Medical Center, Birmingham, AL, USA; 2Tibotec Therapeutics, Bridgewater, NJ, USA; 3Tibotec Inc., Yardley, PA, USA
ABSTRACT
Background: An integrated 24-week (wk) analysis was performed on data from two openlabel, non-randomized trials (TMC114-C215 and -C208 [POWER 3]) to further evaluate the safety and efficacy of darunavir/ritonavir (DRV/r; formerly TMC114/r) 600/100mg bid in treatment-experienced patients (pts) with HIV.
Methods: Three hundred twenty-seven pts received DRV/r 600/100 mg bid plus an optimized background regimen based on screening resistance testing (determined using phenotypic Antivirogram [Virco] data) and treatment history and were included in the integrated POWER 3 analysis. Of these pts, 303 were newly recruited and 24 rolled over from the control arms of prior DRV studies after virologic failure. The primary efficacy endpoint was proportion of pts with ≥1 log10 reduction in HIV RNA by Wk 24 using intent-to-treat analysis.
Results: At baseline (BL), pts had a median of 3 primary PI mutations, median CD4 count of 115 cells/mm3 and mean HIV RNA of 4.63 log10 copies/mL. Nearly all (≥98%) pts had received ≥2 PIs, ≥1 NNRTI and ≥4 NRTIs. Of 327 pts enrolled and included in the safety analysis, 246 reached Wk 24 and were included in the efficacy analysis. HIV RNA <50 copies/mL and ≥1 log10 reduction in HIV RNA were achieved by 40% and 65% of pts, respectively. BL fold change (FC) to DRV was the strongest predictor of virologic response; reduced responses were seen in pts with BL FC >10. At Week 20, CD4 counts rose by a mean of 80 cells/mm3.
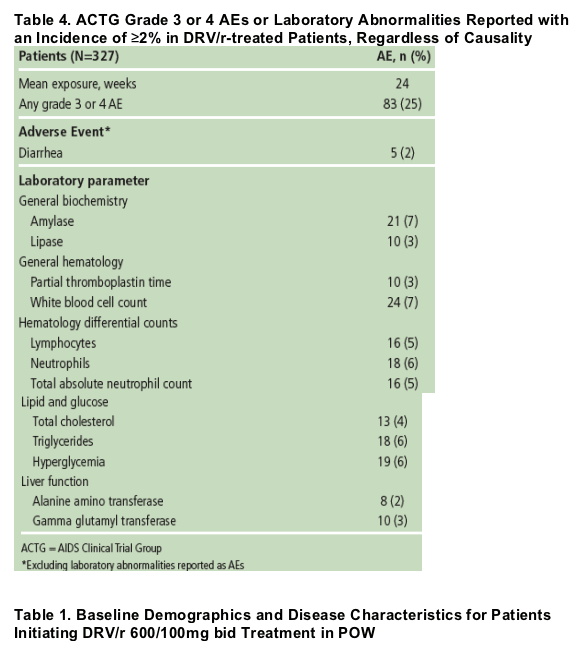
The most commonly reported AEs were diarrhea (14%), nasopharyngitis (11%) and nausea (10%). The majority of AEs (89%) were grade 1 or 2 in severity and discontinuations due to AEs were infrequent (2%). Grade 3 or 4 abnormalities in AST, ALT, triglycerides an cholesterol were infrequent.
Conclusions: DRV/r 600/100mg bid was generally safe and well tolerated in a large group of treatment-experienced pts and provided significant reductions in HIV RNA and increased CD4 counts. BL FC in EC50 to DRV was the strongest predictor of virologic response.
Safety
DRV/r was generally safe and well tolerated.
Few patients (2%) discontinued treatment due to AEs. Overall, 8% of patients discontinued (2% of discontinuations were due to virologic failure).
The most common treatment-emergent AEs, except for ENF-related injection-site reactions, were diarrhea (14%), nasopharyngitis (11%) and nausea (10%).
Most AEs were generally mild (Grade 1) to moderate (Grade 2) in severity; 25% of patients reported ≥1 Grade 3 or 4 AE. Grade 3 or 4 AEs occurring in ≥2% of patients are shown in Table 4. Treatment-emergent Grade 3/4 triglyceride, cholesterol, alanine aminotransferase (ALT) and aspartate aminotransferase (AST) elevations occurred in 6%, 4%, 2% and 2% of patients, respectively; none led to withdrawal.
The overall incidence of serious AEs was 13%. The overall profile of Grade 3 or 4 events was similar in the DRV/r and the control group; no dose relationship with DRV/r was observed and there was no clear relationship between DRV/r dose and the frequency or severity of AEs. None of the 6 deaths on study was attributed to DRV/r.
Mean changes (SD) from baseline to Week 24 in lipid laboratory parameters were small, with changes of -30.9 (290.9), 16.6 (52.9), and 16.2 (34.4) mg/dL recorded for triglycerides, total cholesterol and LDL, respectively.
RESULTS
A pre-planned interim 24-week analysis performed in September 2005 included 327 de novo patients, 246 of whom had reached Week 24 or discontinued earlier. To support discussions with regulatory agencies, an updated efficacy analysis was performed using a cut-off of May 31, 2006.
In this updated analysis, all 327 patients reached Week 24 and 324 reached Week 48 or discontinued earlier.
Week 24 results were previously reported.9 Updated Week 48 efficacy results are presented here. Safety results described are based on the September 2005 cut-off.
Baseline characteristics
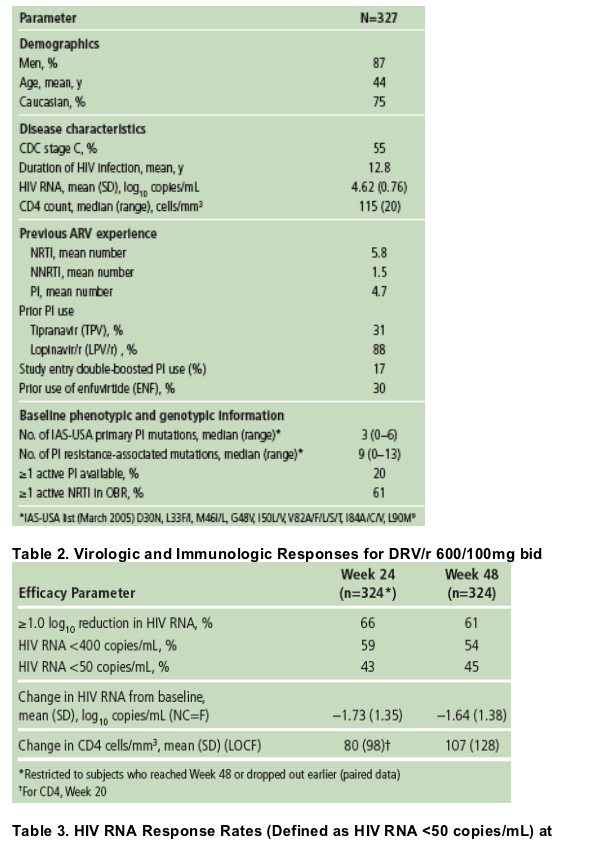
Baseline characteristics are shown in Table 1. The study population had previously received extensive ARV treatment: almost all patients (98%) had received at least two prior PIs, at least one NNRTI and at least four NRTIs.A total of 103 (31%) patients had previously used tipranavir (TPV).
72% of patients had BL FC to DRV ≦10, 14% had FC >10-40, and 14% had FC >40.
According to the IAS-USA 2005 classification,10 patients had a median of three primary PI mutations, with only 20% of patients showing sensitivity to another approved PI at screening (based on Antivirogram data), excluding TPV, which was not available at the time of study recruitment.
Overall efficacy
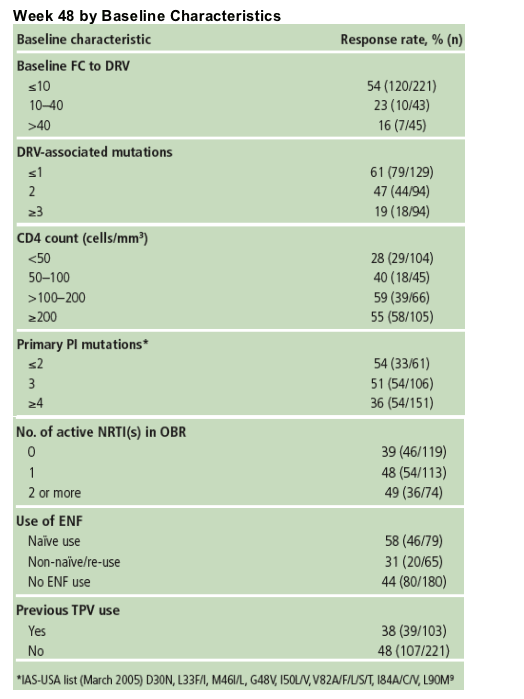
Virologic and immunologic response at Week 24 and Week 48 are presented in Table 2.
At Week 24, HIV RNA <50 copies/mL and ≥1 log10 reduction in HIV RNA were achieved by 43% and 66% of pts, respectively.
60.8% of patients achieved ≥1 log10 reduction in HIV RNA through 48 weeks, and 45.1% of patients reached HIV RNA <50 copies/mL (Figure 1).
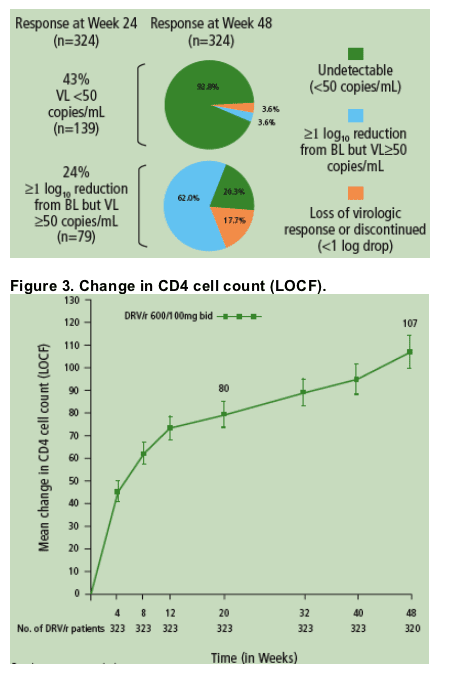
Most patients (92.8%) who achieved <50 copies/mL at Week 24 remained undetectable at Week 48 (Figure 2).
The majority (82.3%) of patients who achieved ≥1 log10 reduction in HIV RNA but did not achieve full virologic suppression to <50 copies/mL maintained or improved virologic response at Week 48 (Figure 2).
Increases in CD4 cell count were maintained through 48 weeks (Figure 3).
The low rate of viral rebound in patients who achieved ≥1 log10 reduction in HIV RNA from baseline but who were not fully suppressed suggests that DRV may offer a high genetic barrier to the development of resistance in the clinical setting, as suggested by previous in vitro studies.11
Factors influencing treatment response
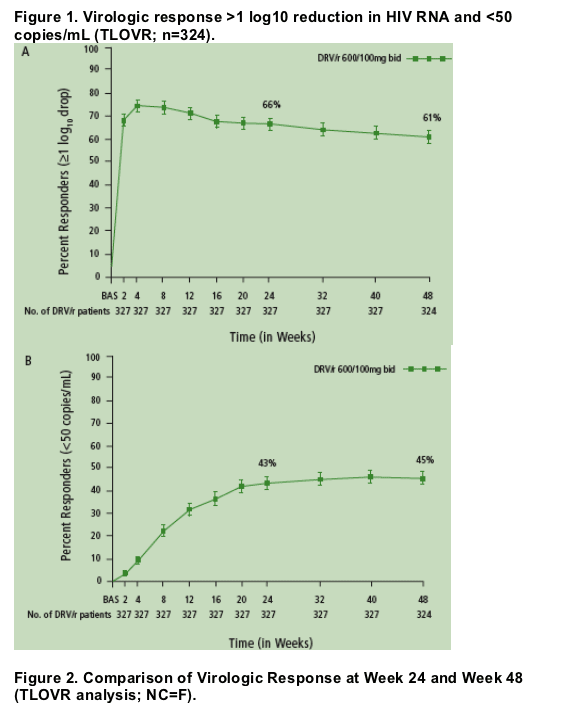
Table 3 shows the influence of baseline factors on treatment response at Week 48.
Baseline phenotypic FC in EC50 to DRV was a strong predictor of response upon multivariate analysis. More patients achieved HIV RNA <50 copies/mL with a baseline DRV FC ≦10 (54%) compared with patients with FC >10 (19%).
There was poor correlation between virologic response and number of primary PI mutations at baseline.
There was strong correlation between virologic response and the number of DRV-associated mutations at baseline.
Higher rates of virologic undetectability (HIV RNA <50 copies/mL) were achieved by patients who had ≥1 active ARV in their OBR.
- 31%, 47% and 53% of patients with 0, 1, or ≥2 active ARVs in the OBR, respectively.
Baseline resistance to TPV (using a clinical cut-off of 3.0) was associated with an increase in baseline FC to DRV; however, the observed mean change in VL of -1.48 log10 (SD=1.45) copies/mL for TPV-resistant patients was similar to that for patients who had not previously used TPV (-1.73 log10 copies/mL [SD 1.35]) and to the overall value of -1.64 log10 (SD 1.38) copies/mL for all patients who initiated treatment with DRV/r 600/100mg bid.
|
| |
|
 |
 |
|
|