 |
 |
 |
| |
PK of Reyataz & Reyataz/r: viral response, lipids, bilirubin, AEs
|
| |
| |
Reported by Jules Levin
CROI, Feb 2007, Los Angeles
"Assessment of Pharmacokinetic/Pharmacodynamic Relationships through 48 Weeks from a Study in HIV+,
ARV-naive Subjects Receiving ART Regimens Containing Atazanavir 400 mg or Atazanavir/ritonavir 300/100 mg Once Daily"
R. Bertz1, Y. Wang1, L. Mahnke1, A. Persson1, E. Chung1, M. Mathew2, S. Agarwala1, D. Filoramo1, J. Hammond2 and D. Grasela1
Bristol-Myers Squibb Pharmaceutical Research Institute, Princeton, NJ1 and Wallingford, CT2
Excerpted from NATAP CROI 2007 Clinical Pharmacology Report by John Gerber & Jen Kiser:
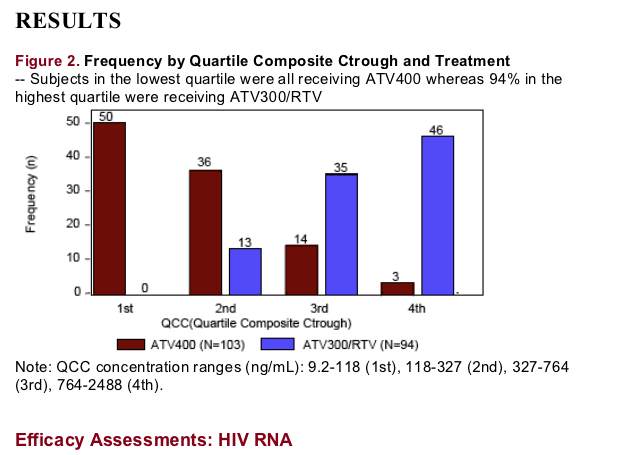
Bertz et al. (Abstract 565) examined the PK/pharmacodynamic relationship with ATV from the BMS 089 study that compared the efficacy and safety of ATV/r (300/100 mg) QD to ATV 400 mg QD combined with 3TC and d4T XR in treatment-naive subjects. The efficacy data has been previously presented and showed that ATV 400 mg QD was non-inferior to ATV/r. What was remarkable in this study was that the vast majority of subjects achieved HIV-RNA <400 copies/mL by week 48. Although ATV Cmin was associated with the probability of achieving HIV-RNA <400 c/mL and <50 c/mL, even with the ATV Cmin in the lowest quartile (9.2-118 ng/mL) the percent of patients with HIV-RNA <50 c/mL was 74% and in the highest quartile (764-2488 ng/mL) the percent with HIV-RNA <50 c/mL was 89%. Total bilirubin and probability of jaundice were positively correlated with Cmin, but lipid changes to the regimen had a weak correlation to ATV Cmin. Although these data were interesting, it would have been of interest to know the overall adherence and selective drug adherence in subjects with very high ATV Cmin but still detectable HIV-RNA.
My summary:
".....Atazanavir Ctrough was associated with the probability of HIV RNA <400 and <50 c/mL at 48 wks (pē0.001).....Subjects in the lowest to highest Ctrough quartile with HIV RNA <400 c/mL were 88%, 91%, 96%, and 95% and <50 c/mL were 74%, 75%, 85%, and 89%, respectively..... Higher ATV Ctrough are associated with increases in hyperbilirubinemia....The probability of jaundice and jaundice and/or scleral icterus (p=0.002) were positively associated with ATV Ctrough....Diarrhea and nausea were not associated with ATV Ctrough (p>/=0.3)....Higher ATV Ctrough and ATV300/RTV regimen were associated with greater increases in fasting TG and TC; note that higher ATV Ctrough are associated with coadministration of RTV...Despite a statistically significant regimen effect for fasting TG (p=0.024) and TC (p=0.030) elevations, only a weak positive correlation of ATV Ctrough with fasting TG and TC was noted (R<0.2, Table 4); suggesting an association with RTV administration, rather than the higher ATV Ctrough values..."
BACKGROUND
Atazanavir (ATV) is a once-daily (QD) protease inhibitor (PI) extensively studied in treatment-naive and experienced patients
The inhibitory effect of low-dose ritonavir (RTV) on cytochrome P450 (CYP) 3A4 substantially increases ATV concentrations
-- ATV AUC and Cmin in the ATV/RTV 300/100 mg QD (ATV300/RTV) regimen was 4 and 12-fold greater, respectively, as compared to the ATV-400 mg QD (ATV400) regimen at steady state1
BMS 089 was a randomized, open-label, multicenter, 96-week study designed to compare the efficacy and safety of ATV300/RTV with that of ATV400 in HIV treatment-naive subjects
-- In a 48-week analysis of this study, virologic response rates were 86%;85% (ATV300/RTV;ATV400) and 75%;70% (ATV300/RTV;ATV400), for the <400 and <50 c/mL time to loss of virologic response (TLOVR) analyses, respectively (non-inferiority, delta -10%, ATV300/RTV-ATV400)2
This current analysis explores the pharmacokinetic/ pharmacodynamic (PK/PD) relationship between ATV exposure (trough concentrations) and PD endpoints as well as the association with RTV through 48 weeks (wks)
EXPLORATORY OBJECTIVES
To evaluate the relationship between ATV trough plasma concentration (Ctrough) and ATV efficacy as assessed by both virologic response and CD4 cell count
To evaluate the relationship between ATV Ctrough and the presence of RTV and selected laboratory parameters and adverse events.
In the 089 study, treatment regimens include:
-- ATV 300 mg QD + RTV 100 mg QD + lamivudine (3TC) 300 mg QD + stavudine (d4T) extended-release 100 mg QD
-- ATV 400 mg QD + 3TC 300 mg QD + d4T extended-release 100 mg QD
Subjects were prohibited from taking proton pump inhibitors and were restricted to H2-receptor antagonist if temporally separated from study treatment
Pharmacokinetics (PK):
PK Parameters evaluated:
-- Ctrough: Trough plasma concentration samples to be collected ~ 24 hours (h) after the last dose of study medication following 2, 4, 8, 12, 16, 24, 32, 40, and 48 wks of treatment from all subjects
-- Population inhibitory quotient (IQ): ATV Ctrough/historical population mean protein binding-adjusted EC90 for ATV against clinical isolates from HIV ARV-naive subjects (14 ng/mL)
-- Individual IQ: ATV Ctrough/individual's protein binding-adjusted EC90 for ATV against HIV available from 32% (64 of 197) of subjects at baseline. EC90 was determined from the subject's virologic EC50 at baseline using the following conversion: ATV protein binding-adjusted EC90 (ng/mL) = ATV EC50 (_mole/L) x 3 x 7 x 704.9
-- Composite Ctrough, population IQ, and individual IQ: Within subject geometric mean of all values over 48 wks (ie, Week 2 to 48) for each subject, or for the composite individual IQ for subjects with available phenotype baseline data
- ATV and RTV concentrations were analyzed by liquid chromatography/mass spectrometry/mass spectrometry (LC/MS/MS)
-- ATV and RTV standard curve range: 5-5000 ng/mL
Pharmacodynamics
HIV RNA, CD4 cell count, and laboratory parameters [alanine serum transaminases (ALT), asparate serum transaminases (AST), total bilirubin (TBIL), fasting glucose, fasting triglycerides (TG), total cholesterol (TC),
fasting low density lipoprotein (LDL), and high density lipoprotein (HDL)]
Performed at baseline (Day 1) and at 2 (HIV RNA/CD4 cell count only), 4, 8, 12, 16, 24, 32, 40 and 48 wks
Adverse events (all grades) of jaundice, scleral icterus, diarrhea, and nausea reported through Week 48
Statistics
-- Ctroughs were excluded from analyses if the sample was taken outside 20-28 h of the previous day's ATV dose (24 ± 4 h), the meals were completed > 30 minutes before, or 60 minutes after the previous day's ATV dose, there was incomplete information on sampling, dosing, and/or meal times, the sample was collected following the next dose, or Ctrough was below LOQ of 5 ng/mL
-- Ctrough, composite Ctrough, and IQs were summarized by treatment and by wk and treatment. Composite Ctrough were also summarized by quartiles (quartile composite Ctrough, QCC)
HIV RNA and CD4 Cell Count
-- Analyses were performed for subjects who received at least 40 wks of study therapy and had an HIV RNA measurement on or after Week 40
--The relationship between the rate of decrease in log10 HIV RNA (estimated from the wk with maximum decrease in HIV RNA) and ATV composite Ctrough was assessed by Pearson correlation coefficient. Similar analyses were performed for the increase in CD4 cell count
-- General linear model was fitted to data from the first 8 wks, with log10 HIV RNA at baseline and log (Ctrough) as covariates, wk as fixed factor, and measurements within subjects as repeated measurements
-- Logistic regression analyses were performed to evaluate the relationship between ATV composite Ctrough and the proportions of subjects with HIV RNA <50 and <400 c/mL at Week 48, respectively. Odds Ratios, 95% confidence intervals (CI), and the predicted probability curve with corresponding 95% confidence bands were assessed
Laboratory Parameters: Pearson correlation coefficients and general linear models were used to evaluate the relationship between ATV composite Ctrough and the laboratory parameters
Adverse Events (AEs): Logistic regression was used to evaluate the relationship between ATV composite Ctrough and AEs
THE STUDY
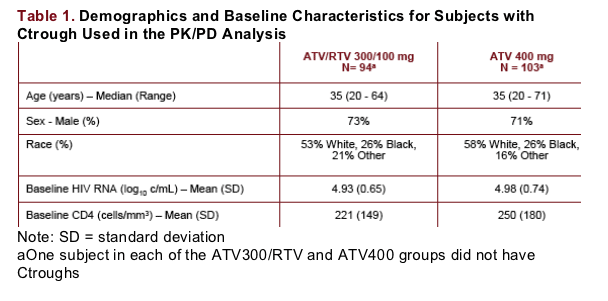
200 HIV-infected subjects were randomized in the primary study cohort (95 and 105 subjects in the ATV300/RTV and ATV400 groups, respectively). All subjects randomized to ATV300/RTV and 104 of 105 randomized to ATV400 were treated.
11 subjects in the ATV300/RTV group and 10 subjects in the ATV400 group discontinued before Week 48; no subjects in the ATV300/RTV group and 3 (3%) of 105 subjects in the ATV400 group discontinued due to lack of efficacy.
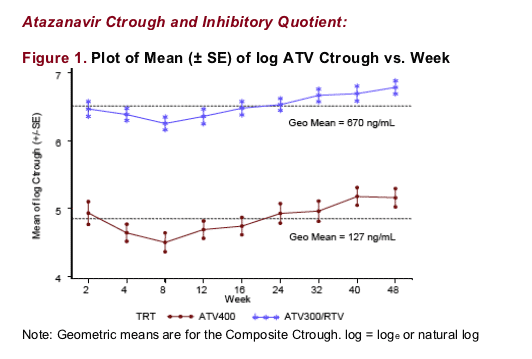
Ctrough values were relatively stable from Weeks 2 through 48 within the typical variability of ATV
82% and 79% of subjects in ATV300/RTV and ATV400 regimens, respectively, had 7 or more trough samples meeting the protocol-defined criteria
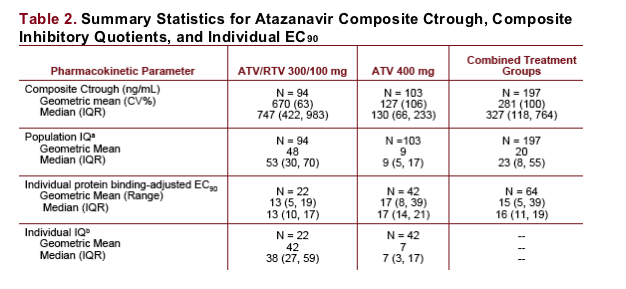
All subjects receiving ATV300/RTV and 98% (101 of 103) of subjects receiving ATV400 were at or above the historical population mean protein binding-adjusted EC90 for ATV against HIV (14 ng/mL).
Furthermore, 99% (93 of 94) of subjects receiving ATV300/RTV and 48% (49 of 103) of subjects receiving ATV400 had Ctrough ≥ 10 x historical population mean protein binding-adjusted EC90 (140 ng/mL).
Individual geometric mean protein binding-adjusted EC90 for ATV against HIV (n=64) was comparable to the historical population mean protein binding-adjusted EC90 (15 vs 14 ng/mL).
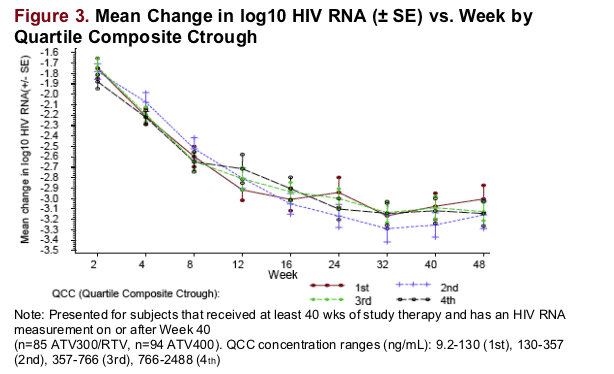
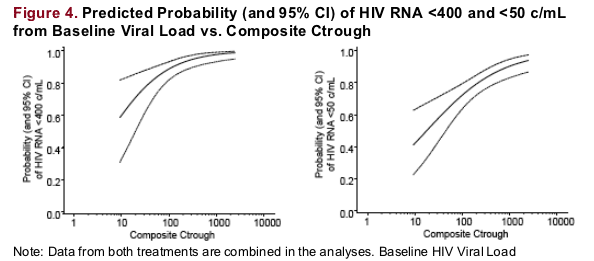
The largest drops in log10 HIV RNA were observed in the first 8 wks of therapy independent of concentration and similar across the Ctrough quartiles.
No association was observed between ATV Ctrough and the slope of maximum decline in HIV RNA (R0.2).
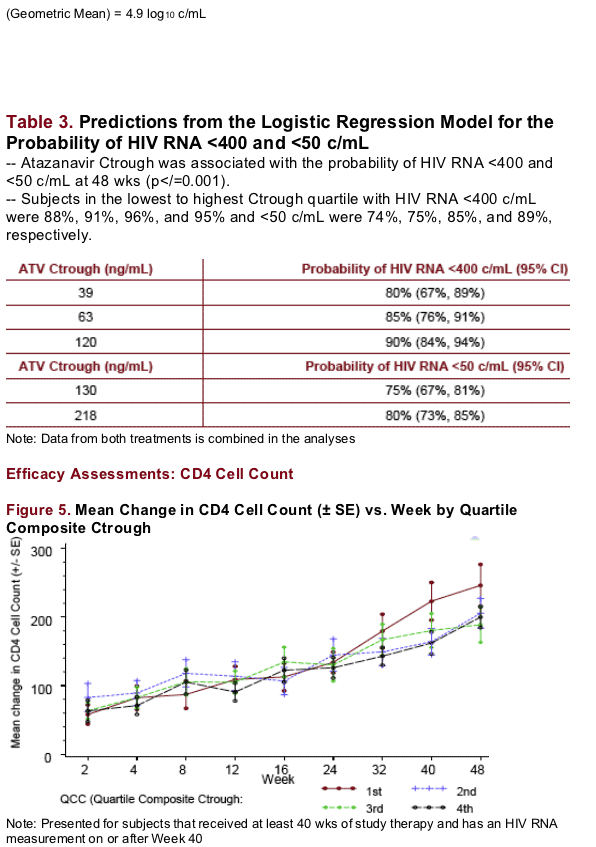

The changes in CD4 cell count were similar across Ctrough quartiles up to 48 wks
At the end of 48 wks, the lowest Ctrough quartile showed a larger increase in CD4 cell count relative to the higher quartiles; mean CD4 cell count increased from baseline to 48 wks by 189 and 224 cells/mm3 in ATV300/RTV- and ATV400-treated patients, respectively.
No association was noted between the slope of increase in CD4 cell count and ATV Ctrough (Rē0.1) for the range of concentration observed.
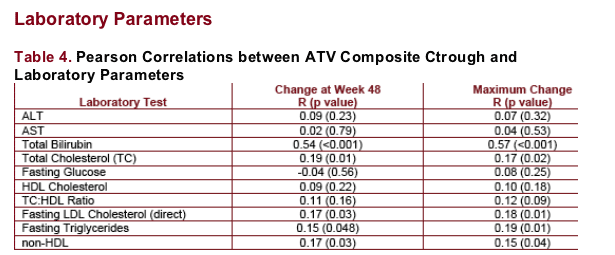
Total bilirubin was positively associated with ATV Ctrough. There was a weaker association with fasting TG, TC, fasting LDL, TC:HDL ratio, and non-HDL.
Fasting glucose, HDL, AST, and ALT were not associated with ATV composite Ctrough.
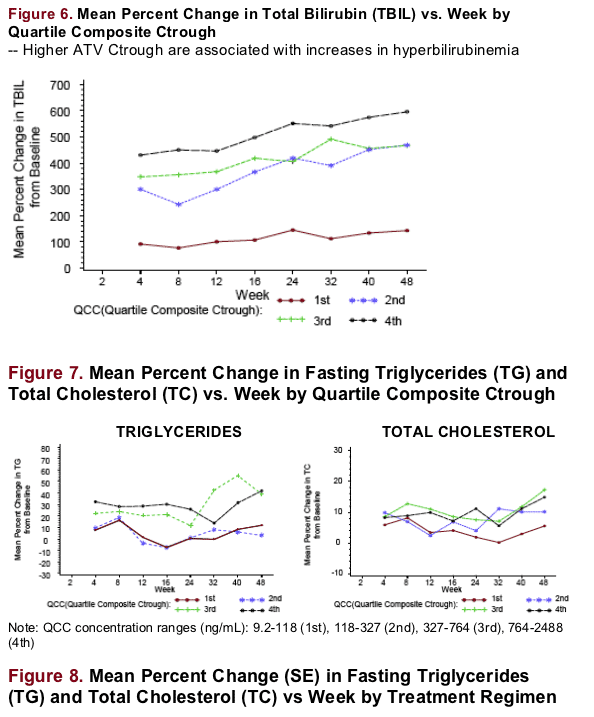
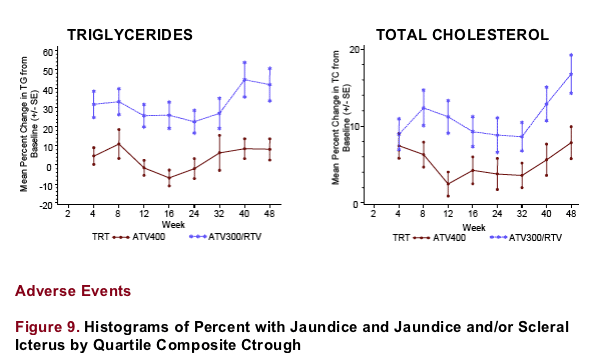
-- Higher ATV Ctrough and ATV300/RTV regimen were associated with greater increases in fasting TG and TC; note that higher ATV Ctrough are associated with coadministration of RTV
-- Despite a statistically significant regimen effect for fasting TG (p=0.024) and TC (p=0.030) elevations, only a weak positive correlation of ATV Ctrough with fasting TG and TC was noted (R<0.2, Table 4); suggesting an association with RTV administration, rather than the higher ATV Ctrough values
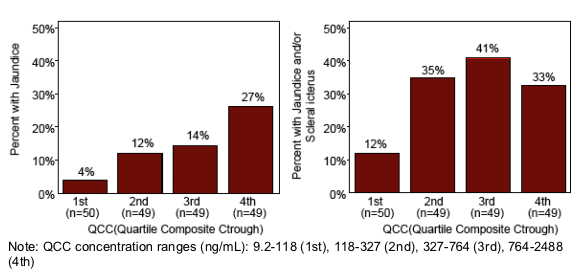
-- The probability of jaundice and jaundice and/or scleral icterus (p=0.002) were positively associated with ATV Ctrough
-- Diarrhea and nausea were not associated with ATV Ctrough (p>/=0.3). The percentage of subjects with diarrhea and nausea from the lowest to highest Ctrough quartiles were 14%, 29%, 18%, and 22% and 8%, 18%, 16%, and 14%, respectively
CONCLUSIONS
All subjects in the ATV300/RTV regimen and 98% of subjects in the ATV400 regimen had Ctroughs above the historical population mean protein binding-adjusted EC90 for ATV against HIV (Ctrough >14 ng/mL)
-- 99% of subjects in the ATV300/RTV regimen had Ctrough ≥ 10 x historical population mean protein-binding adjusted EC90 (Ctrough >/=140 ng/mL)
Individual geometric mean protein binding-adjusted EC90 for ATV against
HIV available from 64 subjects at baseline was comparable to the historical
population mean protein binding-adjusted EC90 obtained from a previous
study (15 vs 14 ng/mL)
In these ARV-naive subjects, Ctrough was associated with the probability
of HIV RNA <400 as well as <50 c/mL at 48 wks; however, even in the lowest
Ctrough quartile, 88% of subjects had HIV RNA <400 c/mL
Total bilirubin and the probability of jaundice were positively associated
with ATV Ctrough
A statistically significant regimen effect, but only a weak correlation of fasting TG and TC with ATV Ctrough was noted; this suggests an association of these lipid elevations with RTV administration
HDL, fasting glucose, AST, or ALT and the probability of diarrhea or nausea
were not associated with ATV Ctrough
|
| |
|
 |
 |
|
|