| |
Effects of Weight, Body Composition, and Testosterone on Bone Mineral Density in HIV-Infected Women
|
| |
| |
JAIDS Journal of Acquired Immune Deficiency Syndromes:Volume 45(2)1 June 2007pp 161-167
Dolan, Sara E RN, PhD(c); Carpenter, Sara BA; Grinspoon, Steven MD
From the Program in Nutritional Metabolism and Neuroendocrine Unit, Massachusetts General Hospital, Harvard Medical School, Boston, MA.
"....Our data demonstrate that bone density is clearly reduced among HIV-infected women with low weight. This effect occurs at the spine and hip. Using the WHO osteoporosis and osteopenia categorization,13 a significantly larger percentage of HIV-infected women with low weight have osteoporosis and/or osteopenia. Indeed, the severity of bone loss among HIV-infected women with low weight is much higher than previously reported among the general population of HIV-infected women. Our data suggest that bone loss is also seen among normal-weight HIV-infected women but not to the degree seen in HIV-infected women with low weight. Fracture risk is closely related to bone density, and may therefore be increased among HIV-infected women, particularly those with low weight.... In this study, HIV-infected women with low weight had additional factors that may have contributed to low bone density (eg, low lean body mass, reduced fat mass, menstrual dysfunction, reduced free testosterone levels).... Future studies should determine if androgen supplementation increases bone density in this population, although such an effect might be indirect, through an effect on lean body mass. Furthermore, studies of estrogen and antiresorptive agents are also critically needed in HIV-infected women. Such therapies do not have the potential to increase bone density, lean body mass, and other parameters simultaneously, however."
Summary:
Recent studies suggest that bone loss occurs among HIV-infected women. This study examined the effects of reduced androgen levels, changes in weight, body composition, and menstrual dysfunction on bone mineral density (BMD) among 152 HIV-infected women characterized by normal weight (>90% ideal body weight [IBW], n = 124) and low weight (≦90% IBW, n = 28) compared with 100 non-HIV-infected control subjects. BMD was assessed by dual x-ray absorptiometry, and free testosterone was assessed by equilibrium dialysis. Abdominal subcutaneous adipose tissue (SAT) and visceral adipose tissue (VAT) were determined by computed tomography scan.
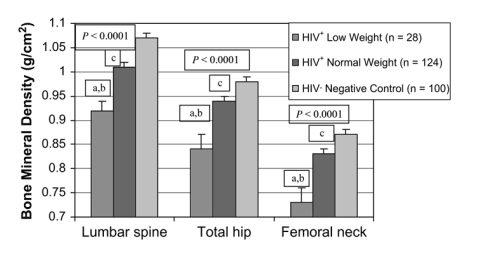
A significant difference was seen in BMD between groups at the lumbar spine (0.92 ± 0.02 g/cm2 vs. 1.01 ± 0.01 g/cm2 vs. 1.07 ± 0.01 g/cm2; P < 0.0001), total hip (0.84 ± 0.03 g/cm2 vs. 0.94 ± 0.01 g/cm2 vs. 0.98 ± 0.01 g/cm2; P < 0.0001), and femoral neck (0.73 ± 0.03 g/cm2 vs. 0.83 ± 0.01 g/cm2 vs. 0.87 ± 0.01 g/cm2; P < 0.0001) (HIV-infected low-weight group, HIV-infected normal-weight group, and non-HIV-infected control subjects, respectively, for each comparison; mean ± SEM).
Among the HIV-infected subjects, lumbar BMD correlated with percent IBW (r = 0.37, P < 0.0001), total body lean mass (r = 0.43, P < 0.0001), total body fat mass (r = 0.35, P < 0.0001), and SAT (r = 0.41, P < 0.0001), but not VAT (r = 0.07, P = 0.417).
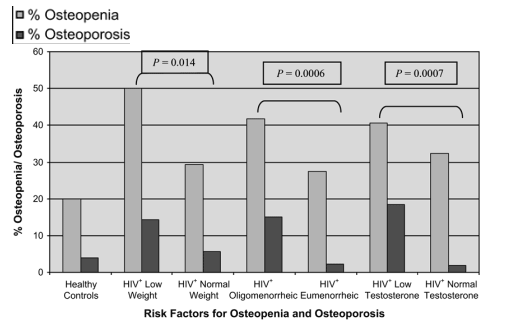
Clinical risk factors for osteopenia and osteoporosis in the HIV population identified in univariate analysis included low free testosterone (<1.1 pg/mL [lower limit of the normal range of free testosterone for women] or 3.8 pmol/L; P = 0.0007), low weight (P = 0.014), and oligomenorrhea (P = 0.0006).
In multivariate regression analysis, lean body mass was most significantly associated with BMD among those with HIV. These data demonstrate that BMD is reduced among HIV-infected women in association with low weight, reduced lean mass, reduced androgen levels, and abnormal menstrual function.
Prior studies have shown reduced bone density in HIV-infected women. The factors associated with bone loss in this population are not clearly understood, however. Reduced bone mineral density (BMD) has been associated with traditional risk factors, including age, smoking, history of low body weight, and hormonal factors in HIV-infected women.1-4
Similarly, androgen deficiency has been reported among women with AIDS wasting syndrome2,5,6 and has been shown to have a negative influence on BMD in this population.3 Furthermore, HIV-infected women often experience changes in weight and body composition.5,7 Reduced muscle mass and increased abdominal adiposity have been associated with low BMD in HIV-infected women and among mixed-gender study populations.3,8,9 In this study, the effects of weight, body composition, and androgen deficiency on BMD are investigated among HIV-infected women and non-HIV-infected control subjects.
DISCUSSION
In the current study, we have included HIV and non-HIV-infected control subjects to determine factors affecting bone density in this population, including weight, body composition, menstrual function, and androgen status. Our data demonstrate that bone density is clearly reduced among HIV-infected women with low weight. This effect occurs at the spine and hip. Using the WHO osteoporosis and osteopenia categorization,13 a significantly larger percentage of HIV-infected women with low weight have osteoporosis and/or osteopenia. Indeed, the severity of bone loss among HIV-infected women with low weight is much higher than previously reported among the general population of HIV-infected women. Our data suggest that bone loss is also seen among normal-weight HIV-infected women but not to the degree seen in HIV-infected women with low weight. Fracture risk is closely related to bone density, and may therefore be increased among HIV-infected women, particularly those with low weight.
In this study, HIV-infected women with low weight had additional factors that may have contributed to low bone density (eg, low lean body mass, reduced fat mass, menstrual dysfunction, reduced free testosterone levels). Androgen deficiency is common among HIV-infected women.6,17 The mechanisms of this effect have previously been shown to include a relative reduction in adrenal androgen production and ovarian androgen production.18 With a sufficiently large study population, using a highly specific assay for free testosterone drawn on fasting morning samples, we are able to demonstrate that approximately 20% of HIV-infected women have androgen deficiency. Furthermore, we demonstrate that the presence of androgen deficiency is associated with an increased prevalence of osteopenia and osteoporosis among HIV-infected women. The effects of androgen deficiency on bone may be attributable to direct effects of androgens on bone in women or to indirect effects, through loss of lean body mass, as shown in the multivariate regression analysis. Testosterone level dropped out of the multivariate regression analysis for bone density when lean body mass was included. These data suggest that loss of lean body mass is an important risk factor for low bone density among HIV-infected women, whereas independent effects of androgen deficiency could not be demonstrated. Furthermore, data derived from the current study support the generally held notion that weight loss is an important factor for androgen deficiency in HIV-infected women.6,17,19 Physiologic androgen replacement is a potential treatment strategy among androgen-deficient HIV-infected women to improve bone density and lean body mass as well as other features of androgen deficiency. Our data suggest that measurement of a morning free testosterone level using dialysis methodology may be useful to stratify the risk of bone loss in this population and determine the need for bone density assessment.
Oligomenorrhea was significantly more prevalent among HIV-infected women and contributed to low bone density in multivariate modeling. Subjects in this study were relatively young, at 40 years of age, and thus largely premenopausal. Prior studies have suggested that menstrual dysfunction is associated with significant bone loss among premenopusal women.20 A significant percentage of HIV-infected women demonstrate menstrual abnormalities, and we have shown in prior studies that bone loss in HIV-infected women is associated with increased bone turnover.2 Therefore, normalization of menstrual function may result in improved bone density in this population. Future studies are necessary to determine the effects of estrogen or other strategies to improve menstrual dysfunction and bone density in HIV-infected women.
Race is an important determinant of bone density. Among non-HIV-infected patients, white women may be at greater risk for bone loss.21 In our study, more women in the low-weight group were white. In the multivariate analysis, white status was indeed significantly and independently associated with bone loss. Thus, this is among the first studies to highlight race as a risk for bone loss among HIV-infected women. To be sure that the differences in bone density across the study groups were not simply a function of differences in racial distribution, we controlled for race in the primary analysis of bone density, and significant differences remained between the groups.
Fat mass and SAT were highly significantly correlated with bone density. Of note, SAT itself, which may be reduced in patients with lipodystrophy, was a significant correlate with bone density in the HIV-infected patients. In contrast to prior studies,9,22 including data from our group, we did not find a correlation between bone density and VAT. Although VAT was increased in the normal-weight HIV-infected patients more than that of the control group, subjects were not selected for lipodystrophy in contrast to prior studies. Thus, the relation seen between VAT and bone density in lipodystrophic patients is not found in a larger, more generalized population of HIV-infected women.
A strength of the current study is that bone density was measured at multiple sites to investigate site-specific patterns of bone loss and risk factors. In this regard, bone loss was most severe in the lumbar spine and relatively less so at the hip and femoral neck. Nonetheless, the same general pattern between the 3 groups was seen at each site. As seen in prior studies of non-HIV-infected patients, reduced androgen levels seemed to have the most impact on lumbar or trabecular bone,23 although this relation was not strong in our study and only approached statistical significance.
In summary, our data highlight the severity of bone loss among low-weight women with HIV. Menstrual dysfunction, reduced androgen levels, decreased weight, lean body mass, and white race may all contribute to bone loss among HIV-infected women. The clinical implications of this study relate to the increased percentage of patients with osteopenia and osteoporosis with these risk factors. Future studies should determine if androgen supplementation increases bone density in this population, although such an effect might be indirect, through an effect on lean body mass. Furthermore, studies of estrogen and antiresorptive agents are also critically needed in HIV-infected women. Such therapies do not have the potential to increase bone density, lean body mass, and other parameters simultaneously, however.
RESULTS
Demographic Data
A total of 152 HIV-infected women and 100 female controls were compared in this investigation. Subjects were similar in age and race (Table 1). The percentage of patients with oligomenorrhea was greater in the 2 groups of HIV-infected subjects (low and normal weight) compared with controls, but was not different between the HIV-infected groups (see Table 1).
Laboratory Data
Free testosterone levels were significantly different between the 3 groups (P = 0.0002 by overall ANOVA; see Table 1). Free testosterone was not different between the HIV-infected groups but was lower in both HIV-infected groups compared with control subjects (see Table 1). The prevalence of androgen deficiency, defined on the basis of the lower limit of normal for women for the equilibrium dialysis assay used (<1.1 pg/mL or 3.8 pmol/L), was highest in the low-weight HIV category versus the normal-weight HIV group (27% vs. 19%), although this difference was not significant. In contrast, the prevalence of androgen deficiency was 12% in the control group. Among all HIV-infected subjects, the percentage of androgen deficiency was 20%. Calcium, FSH, and estradiol levels were not different between the 3 groups (see Table 1).
Bone Mineral Density Data
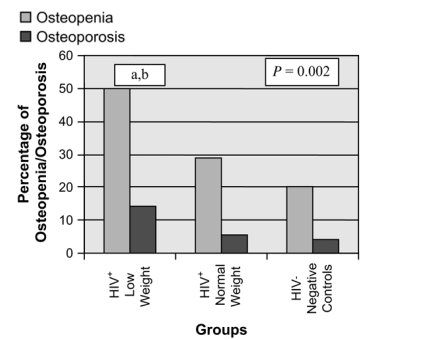
A significant difference was seen in BMD between all 3 groups at the lumbar spine, total hip, and femoral neck (P < 0.0001), and these differences in BMD remained highly significant when controlling for race (data not shown; see Table 1; Fig. 1). Similarly, the percentage of patients with osteopenia and osteoporosis was highest among the HIV-infected group with low weight (P = 0.002; Fig. 2).

FIGURE 1. Comparison of BMD between the 3 groups: HIV+ low weight (≦90% IBW [n = 28]), HIV+ normal weight (>90% IBW [n = 124]), and HIV-negative control subjects (n = 100). These differences in BMD remained significant when controlling for race. P values given for overall ANOVA comparisons between groups at each site. a, P < 0.05 for low-weight HIV-infected group versus normal-weight HIV-infected group; b, P < 0.05 for low-weight HIV-infected group versus controls; c, P < 0.05 for normal-weight HIV-infected group versus controls.

FIGURE 2. Percentage of osteopenia and osteoporosis at the lumbar spine between the 3 groups: HIV+ low weight (≦90% IBW [n = 28]), HIV+ normal weight (>90% IBW [n = 124]), and HIV-negative control subjects (n = 100). The HIV-infected subjects with lower weight had the highest percentage of osteopenia and osteoporosis. P value given for overall ANOVA comparison between groups at each site. a, P < 0.05 for low-weight HIV-infected group versus normal-weight HIV-infected group; b, P < 0.05 for low-weight HIV-infected group versus controls.
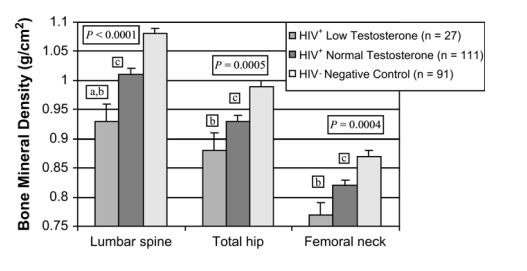
Subjects were also compared by free testosterone level. HIV-infected subjects were categorized into 2 groups based on low free testosterone (<1.1 pg/mL [n = 27, group 1] or ≥1.1 pg/mL [n = 111, group 2]) independent of weight and compared with non-HIV-infected control subjects (n = 91, group 3). Bone density was different by free testosterone category at all 3 sites (Fig. 3).

FIGURE 3. Comparison of BMD and free testosterone between the 3 groups: HIV+ low testosterone (<1.1 pg/mL [n = 27]), HIV+ normal testosterone (>1.1 pg/mL [n = 111]), and HIV-negative control subjects (n = 91). P values given for overall ANOVA comparisons between groups at each site. a, P < 0.05 for low-testosterone HIV-infected group versus normal-testosterone HIV-infected group; b, P < 0.05 for low-testosterone HIV-infected group versus controls; c, P < 0.05 for normal-testosterone HIV-infected group versus controls.
Body Composition Data
As expected, the HIV-infected women with low weight had significantly lower total fat mass (P < 0.0001) and total lean mass (P < 0.0001) (see Table 1). A significant difference in total fat was seen between all 3 groups. A difference in total lean mass was not seen between the HIV-infected subjects of normal weight and the non-HIV-infected control group (see Table 1). VAT was reduced in the low-weight HIV-infected group compared with the normal-weight HIV-infected group and increased in the normal-weight HIV-infected group compared with control subjects. SAT was reduced in the low-weight group compared with the normal-weight HIV group and the control group (see Table 1).
Relation of Laboratory and Body Composition Variables to Bone Density in HIV and Control Subjects
Among the HIV-infected subjects, lumbar spine bone density correlated with percent IBW, total lean mass, and total body fat mass and tended to correlate with free testosterone (Table 2). A significant correlation with lumbar spine bone density was also seen for SAT but not for VAT (see Table 2). Similarly, significant correlations were seen for the total hip and femoral neck (see Table 2). The correlations with free testosterone were not significant at these sites. Smoking was not associated with bone density.
For the control subjects, significant correlations were seen between lumbar spine bone density and percent IBW, lean mass, and fat mass. VAT and SAT were significantly correlated with lumbar BMD. Lean mass, total body fat, percent IBW, and SAT were significantly correlated with femoral neck and total hip BMD (see Table 2).
Relative Risk of Osteoporosis and Osteopenia by Risk Factor Among HIV-Infected Subjects
Among the HIV-infected subjects, low weight (≦90% IBW; P = 0.014), presence of oligomenorrhea (P = 0.0006), and reduced free testosterone (<1.1 pg/mL or 3.8 pmol/L; P = 0.0007) were each associated with increased risk of osteoporosis and osteopenia (Fig. 4).

FIGURE 4. Overview of contributing risk factors for osteopenia and osteoporosis at the lumbar spine among the HIV+ low weight (≦90% IBW), HIV+ normal weight (>90% IBW), and HIV-negative control subjects. The numbers for each group are as follows: healthy controls: n = 100; HIV+ low weight: n = 28; HIV+ normal weight: n = 124; HIV+ oligomenorrheic: n = 60; HIV+ eumenorrheic: n = 91; HIV+ low testosterone: n = 27; HIV+ normal testosterone: n = 111. P values are for comparisons by each risk factor.
Multivariate Regression Analysis
A least squares multivariate regression analysis examining the relation between age, race, menstrual status, free testosterone, and lean body mass and BMD at the lumbar spine, total hip, and femoral neck was performed among all the HIV-infected subjects (Table 3). For the lumbar spine, race, menstrual status, and lean mass were most significantly associated with BMD in a model, accounting for 34% of the variance in BMD. For the total hip, race, menstrual status, and lean mass were most significant in the model, accounting for 39% of the variance in BMD. For the femoral neck, lean mass and race were significant in the model, accounting for 30% of the variance in BMD. Free testosterone was not significant in any of the models.
METHODS
Subjects
Subjects for this analysis were originally recruited for 3 separate investigations. All 3 studies were of women: 2 investigated the effects of testosterone in HIV-infected women, and the third was a cross-sectional investigation of endocrine function and metabolic parameters among HIV-infected and non-HIV-infected control subjects.2,3,6,10 Bone density data on a subset of the patients in these studies have been previously published,2,3,10 and baseline data were analyzed for this analysis before any intervention. Subjects were excluded for pregnancy and age <18 or >60 years. Use of androgens, oral contraceptives, megestrol acetate, growth hormone, or progestational derivatives within 3 months of the study was exclusionary. Subjects who initiated a new antiretroviral therapy within 6 weeks of enrollment were also excluded, as were subjects with active substance abuse, an aspartate aminotransferase level >2083 nanokatal (nkat/L) (125 U/L), a creatinine level >177 μmol/L (2.0 mg/dL), or a hemoglobin level <90 g/L (9.0 g/dL). The non-HIV-infected control subjects met the same entrance criteria, and HIV-negative status was confirmed with enzyme-linked immunosorbent assay (ELISA) testing. All subjects were recruited through hospital- and community-based HIV clinics, AIDS service organizations, and a newspaper advertisement. All subjects gave written informed consent, and participation was approved by the Human Research Committee at the Massachusetts General Hospital and the Committee on the Use of Humans as Experimental Subjects at the Massachusetts Institute of Technology. Eligible subjects were seen at the General Clinical Research Centers at the Massachusetts General Hospital and the Massachusetts Institute of Technology.
Clinical Assessment
Subjects arrived after a 12-hour fast. Health histories, including menstrual status and smoking history, were obtained, in addition to a physical examination. Subjects were characterized on the basis of menstrual history as eumenorrheic (normal menstrual function over the 3 months before study enrollment) or oligomenorrheic (<3 periods in the 3 months before study enrollment). BMD data; body composition; and calcium, serum free testosterone, follicle-stimulating hormone (FSH), and estradiol levels were assessed.
Bone Density and Body Composition Assessment
BMD of the lumbar spine, total hip, and femoral neck and total lean and fat mass were measured by dual x-ray absorptiometry (DXA) using a Hologic 4500 densitometer (Hologic, Waltham, MA). The in vivo precision for the measurement of bone density using the DXA technique is 0.5% to 1.5% at the lumbar spine,11 and the standard deviation of the lumbar spine bone density is 0.01 g/cm.2,12 Ethnicity-specific T scores provided by the manufacturer (Hologic) were used to determine osteopenia and osteoporosis based on World Health Organization (WHO) definitions (osteopenia: T score <-1.0 SD and ≥-2.5 SDs; osteoporosis: T score <-2.5 SD).13 The DXA has a precision error of 3.0% for total body fat mass and 1.5% for total lean mass.14 Body mass index (BMI) and percent ideal body weight (IBW) were calculated based on fasting weight and height measurements. A cross-sectional abdominal computed tomography (CT) scan at the level of the L4 pedicle was performed to determine abdominal visceral and abdominal subcutaneous adipose tissue (VAT and SAT) areas. Subcutaneous and intra-abdominal fat was quantified with image analysis software (ALICE, 4.3.9; Parexel Corporation, Waltham, MA). The body perimeter was identified on the scans using a crude manual trace to encompass the torso, followed by a shrink wrap algorithm that identified the surface. A manual trace was then performed through the internal surface of the abdominal wall musculature. Scan parameters for each image were standardized (144 table height, 80 kV, 70 mA, 2 seconds, 0.25 cm X 4-slice thickness, and 48 field of view [FOV]). Fat attenuation coefficients were set at -50 to -250 Hounsfield units (HU).15
Laboratory Methods
Serum free testosterone levels were measured as the product of the percentage of free testosterone, as determined by equilibrium dialysis, and the total testosterone concentration (Esoterix, Calabasas Hills, CA). The intra-assay CV was developed using pooled serum samples covering the range of the assay. The intra-assay CV of free testosterone is 6.9%, and the interassay CV is 8.9% to 11.9%. The normal range for free testosterone in adult women is 1.1 to 6.3 pg/mL (3.8-21.8 pmol/L) (Esoterix). The sensitivity of the measurement of the percentage of free testosterone by this method is 0.1%. Serum FSH was determined using a solid-phase immunoradiometric assay (intra-assay CV of 1.6%-2.3% and interassay CV of 3.2%-3.8%) (Nichols Institute, San Juan Capistrano, CA and Diagnostic Products Corporation, Los Angeles, CA). Estradiol was measured by a radioimmunoassay (RIA) kit with an intra-assay CV of 6.5% to 8.9% and an interassay CV of 7.5% to 12.2% (Diagnostic Systems Laboratories, Webster, TX). Serum calcium was measured using standard laboratory techniques at the clinical laboratory at the Massachusetts General Hospital.
Statistical Methods
Definition of Comparison Groups
For the analysis, HIV-infected subjects were pooled and categorized into 2 groups based on weight (≦90% IBW [n = 28, group 1, low weight] or >90% IBW [n = 124, group 2, normal weight]) and compared with non-HIV-infected control subjects [n = 100, group 3, control]. Weight ≦90% IBW was used in accordance with prior Centers for Disease Control and Prevention (CDC) definitions of significant low weight in HIV infection.16 Bone density and other variables were compared between the 3 groups by ANOVA for continuous variables and by likelihood ratio for categoric variables. Post hoc comparisons were made between individual groups by t test if the overall ANOVA was <0.05. For categoric variables, individual groups were compared by likelihood ratio. In a 1-way ANOVA, the total sample of 252 subjects achieves 80% power to detect an average deviation of the means of 0.03 g/cm2 versus the alternative of equal means using an F test with a 0.05 significance level, assuming a common SD of 0.14 g/cm2, based on prior studies.2
Univariate regression analyses were performed comparing endpoints of interest with bone density among all the HIV-infected subjects. A separate univariate regression analysis was performed among control subjects.
Least squares regression modeling was performed among the HIV-infected subjects for relevant factors potentially related to BMD. Variables were chosen for inclusion in the model that were significant or approached significance (P < 0.10) in univariate regression analysis. Furthermore, all variables were tested for colinearity in pairwise comparisons, and variables with colinearity (r > 0.7) were not included in the analysis.
All statistical analyses were performed using JMP for SAS 5.1 (SAS Institute, Cary, NC) and SAS 8.2. Values are expressed as mean values ±SEM unless otherwise indicated. Significant differences were defined as P values less than or equal to 0.05.
|
|
| |
| |
|
|
|