| |
HIV+ With Nonalcoholic Fatty Liver Disease Have a Lower Body Mass Index and Are More Physically Active Than HIV-Negative Patients
|
| |
| |
JAIDS Journal of Acquired Immune Deficiency Syndromes:Volume 45(4)1 August 2007pp 432-438
Mohammed, Saira S BHE, MSc; Aghdassi, Elaheh PhD, RD; Salit, Irving E MD; Avand, Ghazal MSc; Sherman, Morris MD; Guindi, Maha MD; Heathcote, Jenny E MD; Allard, Johane P MD
From the Department of Medicine, University Health Network, University of Toronto, Toronto, Ontario, Canada.
Supported by the Ontario HIV Treatment Network (OHTN).
Presented in part at the OHTN Research Conference, November 2006, Toronto, Ontario, Canada [poster]; Second Annual Canadian Association for the Study of the Liver (CASL) Winter Meeting, March 31-April 2, 2006, Toronto, Ontario, Canada [poster]; OHTN Research Conference, 2005, Toronto, Ontario, Canada [poster]; Canadian Society of Clinical Nutrition (CSCN) Fourth Annual Scientific Meeting, September 8-10, 2005, Montreal, Quebec, Canada [posters]; Canadian Federation of Biological Societies (CFBS) 48th Annual Meeting, Second Northern Lights Summer Conference, June 21-24, 2005, Guelph, Ontario, Canada [poster]; and 20th Annual Sheila Sherlock Liver Research Day, April 2005, Toronto, Ontario, Canada [abstract].
Abstract
Objective: To determine whether the clinical and metabolic features associated with nonalcoholic fatty liver disease (NAFLD) are similar between HIV-positive and HIV-negative male subjects.
Methods: Twenty-six HIV-positive and 25 HIV-negative subjects with liver biopsy-proven NAFLD were compared for liver histology (extent of steatosis, steatosis grading, and fibrosis staging), blood biochemistry (glucose, insulin, C-peptide, hemoglobin A1c, and lipid profile), insulin resistance (IR) using a homeostasis model assessment, anthropometry (body mass index [BMI], waist circumference, and arm muscle area), dietary intake, and physical activity.
Results: The 2 groups were similar for age, liver histology, and IR. HIV-positive patients had a lower BMI (26.3 ± 0.5 vs. 30.2 ± 1.0 kg/m2; P = 0.001) and lower percentage of fat mass (19.4 ± 0.9 vs. 22.7 ± 1.2; P = 0.026) when compared with HIV-negative patients. Although caloric intake was similar between groups, HIV-positive patients had a higher physical activity level (8.3 ± 1.6 vs. 4.1 ± 0.8 units of exercise per day; P = 0.029). Blood triglycerides were significantly higher (3.14 ± 0.39 vs. 1.86 ± 0.20 mmol/L; P = 0.006) in HIV-positive patients.
Conclusion: Although NAFLD was similar between the 2 groups, HIV-positive patients had a lower BMI and were more physically active compared with HIV-negative patients. This may suggest that in HIV, NAFLD is associated with factors other than those related to body fatness, such as HIV infection and treatment.
Nonalcoholic fatty liver disease (NAFLD) consists of a spectrum of histologic findings that includes macrovesicular steatosis, nonalcoholic steatohepatitis (NASH), fibrosis, and cirrhosis. In general, those who have simple steatosis have a benign course, whereas those with NASH may progress to more advanced stages of liver disease.1 The pathogenesis of NAFLD is complex, but insulin resistance (IR) and oxidative stress (OS) associated with lipid peroxidation are likely the main contributors.2,3
It is estimated that 17% to 33% of the general population have some degree of steatosis and 5.7% to 16.5% have NASH. NAFLD is becoming a potential public health issue because it is closely linked to the rise in obesity and is associated with metabolic syndrome (MS), which includes diabetes, dyslipidemia, and hypertension.4 The risk of NAFLD is increased with a body mass index (BMI) greater than 25 kg/m2, and it is also associated with a waist circumference of greater than 102 cm for men.5-8 These indicators of body fatness have also been associated with the severity and progression of the disease.9 In addition to genetic predisposition, obesity and NAFLD are likely associated with poor lifestyle habits, such as excess energy intake, dietary intake of poor quality, and reduced energy expenditure because of lack of exercise.10-13
NAFLD may affect 30% to 40% of patients with HIV infection.14 It is not known whether HIV-associated NAFLD develops as a result of obesity and lifestyle or as a consequence of chronic infection and/or HIV medications. Antiretroviral medications have deleterious effects on glucose control, lipid metabolism, body fat redistribution (eg, lipohypertrophy, lipoatrophy, central obesity), IR, and mitochondrial toxicity.15-18 These metabolic profiles can increase the risk for NAFLD; thus, HIV drugs may be a risk factor for NAFLD. To our knowledge, no studies so far have assessed the nutritional parameters in association with NAFLD in HIV-positive patients. Thus, the objective of this study was to compare the nutritional status, MS parameters, and obesity-related factors between HIV-positive and HIV-negative male subjects with NAFLD.
MATERIALS AND METHODS
This was a cross-sectional study. All patients with elevated liver transaminases and suspected NAFLD referred or followed at the hepatology (HIV-negative) and immunodeficiency (HIV-positive) clinics of the University Health Network (UHN) were approached between October 2003 and June 2005. After providing informed consent, patients were enrolled in the study and matched for age.
Subjects were screened if they were older than 18 years of age; were on stable HIV-antiretroviral, lipid-lowering, and diabetic medications for at least 6 months before enrollment; had 1.5 times elevated liver transaminases (aspartate transaminase [AST] and/or alanine transaminase [ALT]); and had convincing evidence of negligible alcohol consumption (<20 g of ethanol per day), as obtained from a detailed history and confirmed by at least 1 close relative. All subjects had a liver biopsy. Subjects were enrolled if diagnosed with NAFLD based on the following histologic criteria: presence of steatosis (>5% fat droplets in the hepatocytes; Table 1)19 with or without macrovesicular fatty degeneration with inflammation (lobular or portal; Table 2),19,20 Mallory bodies, hepatocyte damage, and/or fibrosis (Table 3).19,20
Subjects were excluded if they had liver disease of other causes diagnosed by the absence of findings on histology (eg, chronic viral hepatitis based on hepatitis C virus [HCV] and hepatitis B virus [HBV] antibody and RNA; autoimmune chronic hepatitis; primary biliary cirrhosis; or genetic liver disease such as Wilson disease, hemochromatosis, _-1 antitrypsin deficiency, or biliary obstruction); had complications of liver disease (eg, recurrent variceal bleeding, resistant ascites, spontaneous portosystemic encephalopathy, or bacterial peritonitis, with concurrent acute medical illness); were taking medications known to precipitate steatohepatitis in the 6 months before entry (eg, corticosteroids, high-dose estrogens, methotrexate, amiodarone, calcium channel blockers, spironolactone, sulfasalazine, naproxen, oxacillin, amprenavir); were taking ursodeoxycholic acid or any other experimental drug 6 months before study entry; or were using any antioxidant supplements. The study was approved by the UHN Research Ethics Board.
Assessments and Measurements
Demographic information such as age, weight, BMI, alcohol intake, smoking, and current and past medication and supplement use were collected from the patient's medical chart.
Liver Histology
Liver tissues obtained during the liver biopsy procedure were fixed in formalin and stained using standard techniques. The histologic scoring was performed by a pathologist at the UHN using the grading and staging system developed by Brunt and her colleagues19,20 to assess the degree of steatosis, inflammation, and fibrosis. The pathologist was blinded to the HIV status and the inclusion and exclusion criteria.
Blood Biochemistry
Blood samples were taken in a fasting state and analyzed for measurements of AST, ALT, alkaline phosphatase (ALP), triglycerides (TGs), cholesterol, glucose, C-peptide, hemoglobin (Hb) A1c, and insulin. IR was calculated using homeostasis model assessment (HOMA): IR = [fasting insulin (_U/mL) _ fasting glucose (mmol/L)/22.5]. IR was indicated with HOMA-IR ≥3 as the cutoff value based on previous studies.21-24
Nutritional Assessment
Anthropometric measurements were performed in all patients by a trained nutritionist. BMI was calculated from the height and weight determinations. The BMI classification is as follows: underweight, <18.5 kg/m2; normal, 18.5 to 24.9 kg/m2; overweight, 25.0 to 29.9 kg/m2; and obese, ≥30 kg/m2.25 Body fat parameters and skin folds at triceps were measured to the nearest 1.0 mm with the patient in a standing position using a Lang skinfold caliper (Cambridge Scientific Industries, Cambridge, MA) according to the standard techniques.26-28 Measurements were obtained by the mean of 2 determinations taken on both sides of the body with a nonstretchable tape and skinfold calipers. Arm muscle area (AMA) was calculated as a measure of lean tissue in the body29,30 using the equation developed by Heymsfield et al:31 (midarm circumference [MAC] in cm) - (π _ triceps skinfold in cm)]2/4π - 10 for men.25
Waist circumference was measured by placing a measuring tape horizontally around the waist at the narrowest part of the torso (at the umbilicus for obese subjects) at the end of expiration.25 Hip circumference was measured by using a measuring tape placed horizontally at the greatest part of the buttocks.25 Waist-to-hip ratio (WHR) was then calculated.
Bioelectrical impedance analysis (BIA) was also performed, including measurements of resistance and reactance by a 4-terminal impedance analyzer (model BIA-103; RJL-system, Detroit, MI) using a single-frequency 800-_A current at 50 kHz while the subjects were supine with the arms and legs extended.32,33 Electrodes were attached at standardized positions on the right side of the body. Fat-free mass was estimated using the prediction equation contained in the manufacturer's software, which incorporates information on age, gender, height, and weight. Body fat was then calculated by subtracting the fat-free mass from the total body weight.32,34,35
The presence of lipodystrophy was assessed clinically, as described by Carr and colleagues,36 where patients self-report peripheral fat wasting (face, arms, buttocks, or legs) or central abdominal fat accumulation by answering a questionnaire. The categories with the corresponding range of scores are as follows: absent, 0; very mild, 1 to 8; mild, 9 to 15; moderate, 16 to 24; and severe, 25 to 32.36
At the time of the visit to the clinic, patients were instructed to complete a 7-day food record and a 7-day physical activity diary. A 7-day food record was used to estimate total energy, macronutrient, and micronutrient intakes. It was also used to estimate the level of different types of fat and antioxidant nutrients. The subjects reported all food and beverages consumed for a specified period.37 Subjects were instructed to describe food portions accurately using a 2-dimensional food portion visual chart validated previously in adult men and women aged 20 to 70+ years of age.38 The data were analyzed using Diet Analysis Plus, version 5.1 (Thomson Wadsworth, Salem, OR). Physical activity was also assessed by asking the patients to provide information on the type of activity performed, duration, intensity, and date and time for a period of 7 days. The intensity of the activity was recorded by the method developed by Pan and colleagues,39 which defines the level of activity by the units of exercise.
Sample Size Calculation and Statistical Analyses
The sample size for this study was calculated based on the primary variable, BMI. Studies have shown that cardiovascular risk factors, including MS, increase with BMI in the general population40 and in men.41,42 Based on the results of a longitudinal study,42 and also considering an _ of 0.05, 80% power, and a 2-sided significance, to achieve a minimum difference of 3.0 kg/m2 between the 2 groups, a minimum of 15 subjects per group was required. Because we were interested in comparing other variables, we aimed for a sample size of 25 subjects per group, accounting for 20% dropout.
The unpaired t test was used to compare data on age, liver function test results, anthropometry and body composition, dietary intake, physical activity, and blood biochemistry between the 2 groups. For nonparametric measures, the Mann-Whitney test was used. For the categoric variables, the _2 or Fisher exact test was used when appropriate. A P value <0.05 was considered statistically significant. These statistics were performed using the SPSS software package, version 13.0 (SPSS, Chicago, IL). Data were expressed as the mean value ± SEM or as a percentage (or proportion).
RESULTS
Patient Population and Demographic Characteristics
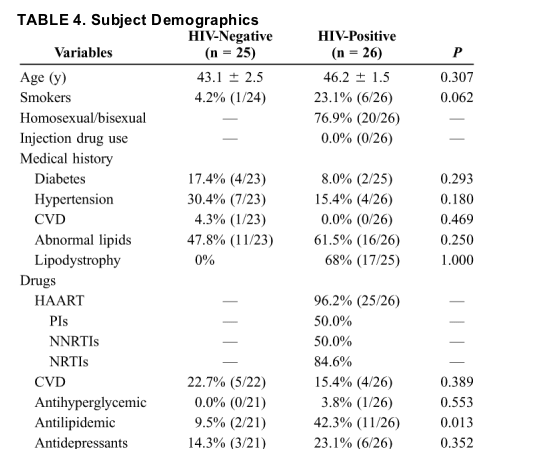
Twenty-six HIV-positive and 25 HIV-negative male subjects with liver biopsy-proven NAFLD were included in this study. Except for the HIV status and drug regimen related to it, the 2 populations were similar in terms of demographics (Table 4). The HIV-positive subjects were largely homosexual (76.9% [20 of 26]) with no history of injection drug use, 96.2% were on HAART, and more than two-thirds had lipodystrophy. In addition, a significantly higher proportion of HIV-positive patients were taking lipid-lowering drugs compared with HIV-negative patients.

Liver Histology
Liver histology (i.e., fibrosis grade, steatosis % and grade, and proportion of subjects with simple steatosis and NASH) was similar between the 2 groups (Table 5).

Blood Biochemistry
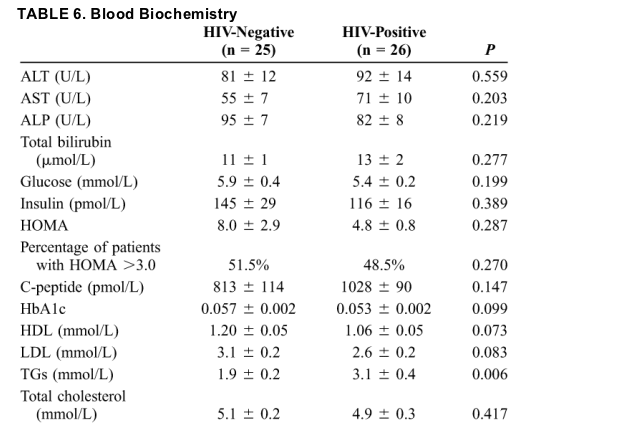
Liver enzymes were similarly elevated in the 2 groups (Table 6). Serum TGs were significantly higher in HIV-positive subjects than in HIV-negative subjects. No significant differences were found in serum glucose, insulin, and HOMA measures, however, and there was a trend toward lower serum HbA1c, high-density lipoprotein (HDL), and low-density lipoprotein (LDL) in HIV-positive patients than in HIV-negative patients. Approximately half of the patients in each group were found to be insulin resistant.

Nutritional Assessment
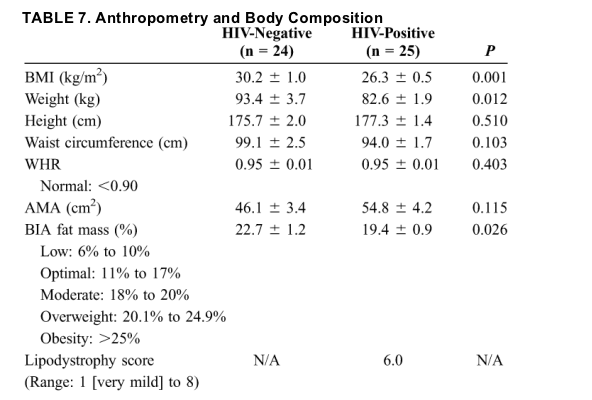
HIV-positive subjects had a lower body weight, BMI, and total percentage of fat mass as assessed by BIA when compared with HIV-negative patients (Table 7). AMA, waist circumference, and WHR were similar between the 2 groups, however. HIV-positive subjects had a low lipodystrophy score, suggesting mild lipodystrophy.

Lifestyle Factors (Nutritional Intake and Physical Activity)
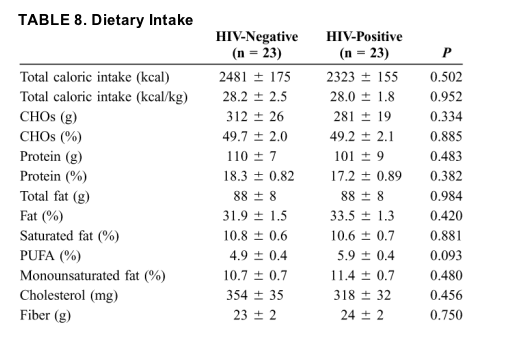
Physical activity was found to be significantly higher, as measured by units of exercise per day, in the HIV-positive group (Fig. 1). Although there were no differences in caloric and macronutrient intake, there was a trend toward a greater percentage of polyunsaturated fatty acid (PUFA) intake (adjusted for mean caloric intake) in the HIV-positive group when compared with HIV-negative patients (Table 8). Both groups consumed a diet low in carbohydrates (CHOs), high in protein, slightly high in fat, and high in cholesterol. In addition, neither group met the recommended adequate intake for fiber (38 g/d for men between 31 and 50 years of age).

DISCUSSION
This study showed that although NAFLD and IR were similar between the 2 groups, HIV-positive patients had a lower BMI and were more physically active compared with HIV-negative patients. This may suggest that in HIV, NAFLD is associated with factors other than those related to body fatness, such as HIV infection and HIV medications.
Since the introduction of HAART for suppression of HIV replication, metabolic abnormalities such as dyslipidemia, IR, mitochondrial toxicity, central fat accumulation, and peripheral fat loss, along with alterations in liver transaminases, are frequently reported in HIV-positive patients.43-45 Some of these metabolic abnormalities are risk factors for NAFLD; in fact, an increase in the prevalence of hepatic steatosis and NASH is reported in HIV-positive patients.46 The pathogenesis for these metabolic abnormalities and NAFLD is not clearly understood. IR has been proposed as one of the factors contributing to the pathogenesis of NAFLD in 47% to 98% of cases, regardless of the coexistence of impaired glucose tolerance or obesity.22,47-49 In the present study, IR was found to be prominent in approximately 50% of HIV-positive and HIV-negative patients. It is unclear whether IR in HIV is a direct result of HIV infection alone or a complication of HAART or MS.
HIV medications can promote IR, and thus may play a significant role in fatty infiltration of the liver. Among the HIV-positive patients who were on HAART in this study (96.2% [25 of 26)]), 64.0% (16 of 25) had IR; for those not on HAART, it was 0.0% (0 of 1). Among those on the HAART regimen, 50% were taking protease inhibitors (PIs) and 50% were taking nonnucleoside reverse transcriptase inhibitors (NNRTIs). There is considerable evidence implicating PIs in the pathogenesis of IR in the adipose tissue, pancreas, liver, and skeletal muscle, likely attributable to the impairment of cellular glucose uptake and the Glut4 glucose transporter.50,51 In addition, 84.6% of HIV-positive subjects were taking nucleoside reverse transcriptase inhibitors (NRTIs). NRTIs may indirectly cause IR by promoting hypoadiponectinemia, hypertriglyceridemia, and fat redistribution from lipodystrophy.50,52,53 Hepatic steatosis is a common occurrence with NRTI-associated lactic acidosis.51 NRTIs are also implicated in mitochondrial toxicity (mitochondrial replication impairment and function), resulting in microvesicular steatosis, lactic acidosis, and mitochondrial depletion possibly evolving to fibrosis and macrovesicular steatosis with focal necrosis45,54 Another potential factor by which HIV could induce IR is tumor necrosis factor-_ (TNF_), which is a cytokine that is chronically released by peripheral blood mononuclear cells in HIV-positive subjects.55 Although TNF_ was not measured in this study, it has been shown to induce IR in other conditions, including obesity56 and systemic infection.50,57 Therefore, HIV medications and chronic infection could both play a role in development of IR, and thus may be involved in the pathogenesis of NAFLD in HIV-positive patients.
Dyslipidemia is another risk factor for NAFLD. HIV infection itself can influence lipid profile and metabolism.58 A study has shown that a higher CD4 lymphocyte count was associated with a lower likelihood of IR. Furthermore, a higher HIV RNA level was independently associated with an inferior lipid profile (lower LDL cholesterol, higher very-low-density-lipoprotein [VLDL] cholesterol, and higher TG levels).58 The precise mechanism for the effects of HIV infection on metabolic parameters is not described, however, and remains unclear. Because HIV-positive subjects from our study had lower HDL and higher TGs, the HIV infection itself may be a factor. In addition, HIV-positive patients using HAART commonly have hypertriglyceridemia, hypercholesterolemia, and decreased HDL cholesterol, and lipodystrophy.59-61 In this study, most HIV-positive subjects were on HAART and had lower HDL and higher TGs, whereas LDL was lower when compared with that of HIV-negative subjects with NAFLD. It may be that the HAART regimen or the HIV infection itself may influence the lipid profiles of these HIV-positive subjects. It is difficult to determine which factors are influencing the serum lipid levels in this group, however.
In addition to chronic infection and medication side effects in HIV, dietary factors may contribute to an abnormal lipid profile, MS, and the development of NAFLD. The number of studies available on the dietary habits of patients with NAFLD in the general population is scarce, however, and we found no such studies in the HIV-positive population. Diets low in saturated fats, high in fiber, and rich in _-3 fatty acids may prevent IR and improve blood lipids, and thus reduce hepatic steatosis. In this study, dietary intake was similar between the 2 groups. In general, HIV-positive patients consumed a diet high in protein and fat, low in CHOs and fiber, and high in cholesterol (intakes exceeded the recommendations of <300 mg/d).62 This type of diet may be favorable to patients with NAFLD, because in a study, higher CHO intakes were associated with increased odds of inflammation in patients with NAFLD from the general population.63 The quality of CHO intake was not analyzed, however. We also found a trend toward a higher percentage of PUFA intake in HIV-positive patients compared with HIV-negative patients. The type of PUFA may be important in NAFLD, because dietary fats, specifically long-chain polyunsaturated fatty acids (LCPUFAs), are involved in the regulation of hepatic lipid metabolism.64 NAFLD associated with obesity is characterized by depletion of hepatic _-3 LCPUFAs.64 PUFA also acts as a substrate to enhance OS because it fuels the production of lipid peroxide products, which can lead to inflammation and more advanced stages of NAFLD. We did not analyze the types of PUFA or quantify _-3 PUFAs; thus, their role in the pathogenesis of NAFLD in HIV remains to be determined.
Body fatness, especially abdominal obesity, is among other risk factors for NAFLD. In this study, the HIV-positive subjects had a lower body weight, BMI, and body fat percentage when compared with HIV-negative subjects. With regard to the BMI classifications of body fatness, HIV-positive patients were slightly overweight, whereas HIV-negative patients were considered obese. Similarly, in terms of percentage of body fat mass, the HIV-positive group was in the moderate category, whereas the HIV-negative group was in the overweight category. In HIV-positive subjects, lipodystrophy is characteristic of abdominal body fat buildup and a side effect of HAART, namely PIs. In this study, however, body fat redistribution assessed by the lipodystrophy score was in the mild range. In addition, waist circumference did not reflect central obesity (>102 cm) in HIV-positive male patients.24 Physical activity plays a role in IR and body fatness. In this study, HIV-positive patients were more physically active, and this was associated with healthier body composition and reduced body fat when compared with HIV-negative subjects. Despite this difference in physical activity, however, the HIV-positive subjects showed similar degrees of steatosis and NASH as the HIV-negative group. Perhaps in a prospective study, those with less exercise and higher body fat would eventually show more progressive disease with fibrosis and cirrhosis.
This study has some limitations. First, this is a cross-sectional design comparing 2 different populations with the same liver condition. The main limitation of a cross-sectional study is that it does not allow for changes over time; thus, we cannot infer a cause, because only the current condition is being studied at a single point in time or a short period of time. Although significant differences were found in anthropometric measures, body composition, and metabolic parameters, this does not mean that there is a cause-and-effect relation. The purpose of this study was to determine whether there was any difference in clinical and metabolic factors associated with NAFLD between the HIV-positive and HIV-negative population, and in this exploratory setting, a cross-sectional design was appropriate.
Among the measurements performed, the 7-day food record is the most challenging. Although the collection and assessment of a 7-day food record is a valid and reliable method for dietary assessment,65,66 it has some limitations (as in any method that captures dietary intake), which may allow for systematic errors in recorded food consumption. These limitations include high participation burden, subject literacy, incorrect estimation of portion sizes, changes in intake behavior at the time of recording, and intrasubject and intersubject variability.37,67 The activity logs used in this study also act as a subjective method of measuring physical activity. Although these logs can usually discriminate between individuals with different energy expenditure levels, activity logs can be time-consuming and inconvenient and can influence the subject's behavior, leading to bias and a source of error.68 This method was used, however, because it was the most practical and convenient way to assess physical activity in a clinical setting. Other more reliable methods (double-labeled water, indirect calorimetry, and direct observation) are expensive and were not feasible.69
In summary, the results of this study suggest that despite the presence of IR and other metabolic abnormalities, NAFLD in HIV-positive male patients is not associated with obesity compared with HIV-negative subjects. This suggests that other factors, such as HIV drugs or the HIV infection itself, may play a role. To our knowledge, this is the first study investigating nutritional and lifestyle behaviors in association with NAFLD in patients with HIV infection.
|
|
| |
| |
|
|
|