 |
 |
 |
| |
Saquinavir/r bid vs Kaletra bid Efficacy Analysis 24 Weeks Gemini Study
|
| |
| |
Saquinavir/ritonavir BID vs lopinavir/ritonavir BID plus emtricitabine/tenofovir QD as initial therapy in HIV-1-infected patients: the Gemini Study 24-week interim analysis
Reported by Jules Levin
4th IAS Conference on HIV Pathogenesis, Treatment and Prevention
22-25 July 2007 Sydney, Australia
Poster WePeB027
SUMMARY
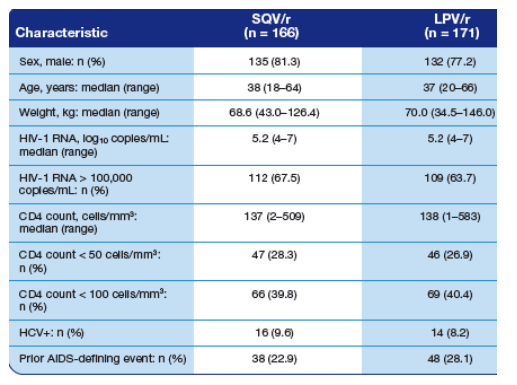
330 study patients had advanced HIV: 135 CD4s and over 100,000 HIV RNA.
VIRAL RESPONSE:
In this 24-week interim analysis, treatment with SQV/r BID plus FTC/TDF QD was comparable to that with LPV/r BID plus FTC/TDF QD in terms of virological suppression and increases in CD4 cells.
- 81.3% in both SQV/r & LPV/r arms had <400 c/ml at week 24 (n=168).
- 69.9% taking SQV/r & 69.0% taking LPV/r had <50 c/ml at week 24 (n=171).
-- At week 24, the median change (range) from baseline in HIV-1 RNA (log10 copies/mL) was nearly identical at -3.4 (-4.5 - 0.6) vs -3.5 (-4.8 - -0.8) in the SQV/r and LPV/r arms
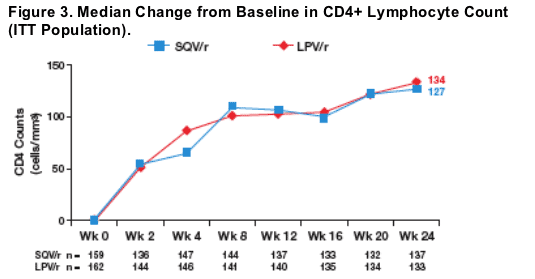
--CD4 increases were similar
Both treatments were well tolerated, although hyperlipidemia was observed in more patients in the LPV/r treatment arm.
- Please see separate NATAP report (Poster TuPeB069) for detailed lipid analysis.
Virological failure (VF) was observed in 10 patients (6%) receiving SQV/r and 3 patients (1.8%) receiving LPV/r. Most VFs were related to adherence. Only 2 of the patients who developed VF (both in the SQV/r arm) developed new PI mutations during the study.
Overall discontinuations were 16.6% in SQV/r and 14.8% on LPV/r.
Reason for withdrawal, safety: 4.3% SQV/r (adverse events: 3.1%, death: 1.2%); LPV/r: 7.1% (6.5% adverse events, death 0.6%). Non-safety reasons: 12.2% SQV/r, 7.7% LPV/r).
The effectiveness of SQV/r BID vs LPV/r BID plus FTC/TDF QD as initial therapy in HIV-1-infected patients will be affirmed in the 48-week analysis of the Gemini trial.
F Raffi,1 D Ward,2 K Ruxrungtham,3 J Brunetta,4 and M Schutz5
1University Hospital, Nantes, France; 2Dupont Circle Physicians Group, Washington, DC, USA; 3HIV-NAT, Thai Red Cross
AIDS Research Centre, Bangkok, Thailand; 4Maple Leaf Medical Clinic, Toronto, Canada; and 5Roche, Nutley, NJ, USA
Highly active antiretroviral therapy (HAART) containing a boosted protease inhibitor (PI) is recommended as firstline treatment for HIV-infected patients in the current IAS-USA guidelines.1
Few studies have so far compared the different boosted PIs as first-line HAART.
The Gemini Study is an ongoing, head-to-head, randomized trial comparing saquinavir/ritonavir (SQV/r) twice daily (BID) vs lopinavir/ritonavir (LPV/r) BID, each taken in combination with emtricitabine/tenofovir (FTC/TDF) once daily (QD).
The results of a 24-week, multicenter analysis of all patients are reported here.
Study Design and Inclusion Criteria
A prospective, Phase IIIb, randomized, open-label, twoarm, 48-week study was conducted in multiple clinical study centers in the USA, Puerto Rico, Canada, France, and Thailand.
Eligible patients (age ≥18 years) met the following criteria:
-- HIV-1 RNA viral load >10,000 copies/mL
-- CD4 ≦350 cells/mm3
-- antiretroviral-naive (<2 weeks of total exposure).
Patients were randomized 1:1 to receive SQV/r 1000/100 mg BID or LPV/r 400/100 mg BID plus FTC/TDF 200/300 mg QD for 48 weeks.
Study Endpoints
The primary efficacy endpoint for this study was the number and percentage of patients with an HIV-1 RNA viral load <50 copies/mL at week 48.
The endpoints reported in this interim analysis are:
-- the percentage of patients with an HIV-1 RNA viral load <50 copies/mL at week 24
-- change from baseline in plasma HIV-1 RNA viral load (copies/mL) at week 24
-- change from baseline in CD4+ lymphocyte count at week 24
- number and percentage of patients discontinuing study medication due to clinical adverse events (including clinically significant laboratory abnormalities and AIDS Clinical Trial Group Grade ≥2 laboratory toxicities) at week 24.
Statistical Analysis
The primary hypothesis for this study is that SQV/r is non-inferior to LPV/r in the proportion of patients with an HIV-1 RNA viral load <50 copies/mL at week 48. The effect size of 12% was used as the criterion to establish non-inferiority.
Table 1. Summary of Patient Demographic and Baseline Data (N = 337).
80% men. Median age: 38. Median weight: 68-70 kg. HIV RNA: 5.2 logs. HIV RNA >100,000: 67%, 63%. Median CD4: 137. CD4 <50: 27%. CD4 <100: 66-69%. HCV+ 9%. Prior AIDS-defining event: 23-28%.
Efficacy
A similar proportion of patients in the SQV/r and LPV/r arms achieved undetectable HIV-1 RNA levels (<50 copies/mL) and levels of <400 copies/mL at all time points during the first 24 weeks of treatment (Figure 1).
The rate and extent of HIV-1 viral load reduction were similar in the SQV/r and LPV/r arms at all time points during the first 24 weeks of the trial (Figure 2).
-- At week 24, the median change (range) from baseline in HIV-1 RNA (log10 copies/mL) was nearly identical at -3.4 (-4.5 - 0.6) vs -3.5 (-4.8 - -0.8) in the SQV/r and LPV/r arms, respectively (Figure 2).
Figure 1. Time Course of HIV-1 RNA Suppression (ITT Population).
- 81.3% in both SQV/r & LPV/r arms had <400 c/ml at week 24 (n=168).
- 69.9% taking SQV/r & 69.0% taking LPV/r had <50 c/ml at week 24 (n=171).
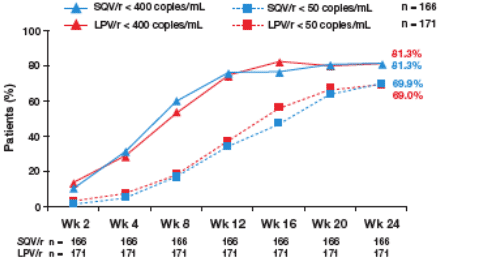
The intent-to-treat (ITT) population included patients who were randomized and received at least one dose of trial medication, and for whom at least one post-baseline viral load evaluation was available.
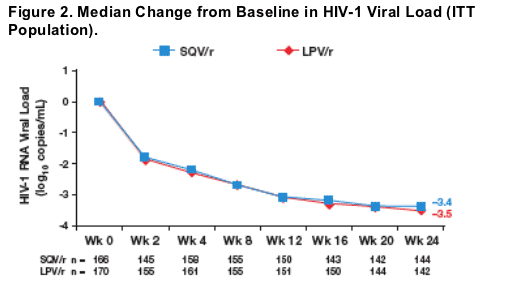
At week 24, the percentage of patients with a -1.0 log10 (HIV-1 RNA copies/mL) change from baseline was ≥97.9% in both SQV/r and LPV/r arms.
The rate and extent of increases in CD4 lymphocyte counts were comparable in the SQV/r and LPV/r arms at all time points during the first 24 weeks of the trial (Figure 3).
-- At week 24, the median change (range) from baseline in CD4 counts was 127 (-71-660) vs 135 (-39.0-604) in the SQV/r and LPV/r arms, respectively (Figure 3).
Safety and Tolerability
Adverse events were comparable in each treatment group (Table 2).
Table 2. Grade III and IV Adverse Events (AEs) Occurring in >3% of
Patients (Safety Population) from baseline to week 24.
Diarrhea: 6.7% on SQV/r, 11.9% on LPV/r.
Nausea: 5.5% on SQV/r, 7.7% on LPV/r.
Vomiting: 5.5% on SQV/r, 4.2% on LPV/r.
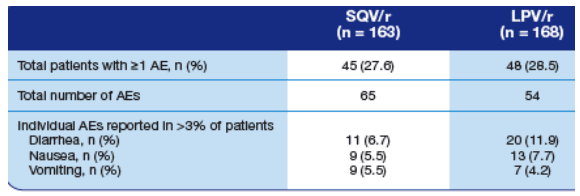
Table 3. Patients with Elevated Plasma Lipids at Baseline and
at Week 24 (Safety Population).
TOTAL CHOL: % >200 mg/dl increased from 13.5% to 21.5% on SQV/r, and from 9.5% to 26.8% on LPV/r.
LDL >130 mg/dl: increased from 15.3% to 19% on SQV/r, and increased from 8.9% to 14.9% on LPV/r.
TG >400 mg/dl: changed from 1.8% to 1.2% on SQV/r, and from 2.4% to 8.9% on LPV/r.

Discontinuations
The overall numbers of discontinuations in each study group were comparable (Table 4).
Of the 3 deaths that occurred during this study, only 1 (hepatic failure in the LPV/r group) was considered to be possibly related to study treatment.
Table 4. Causes of Study Discontinuations.
Overall discontinuations were 16.6% in SQV/r and 14.8% on LPV/r.
Reason for withdrawal, safety: 4.3% SQV/r (adverse events: 3.1%, death: 1.2%); LPV/r: 7.1% (6.5% adverse events, death 0.6%). Non-safety reasons: 12.2% SQV/r, 7.7% LPV/r).

Virologic Failures
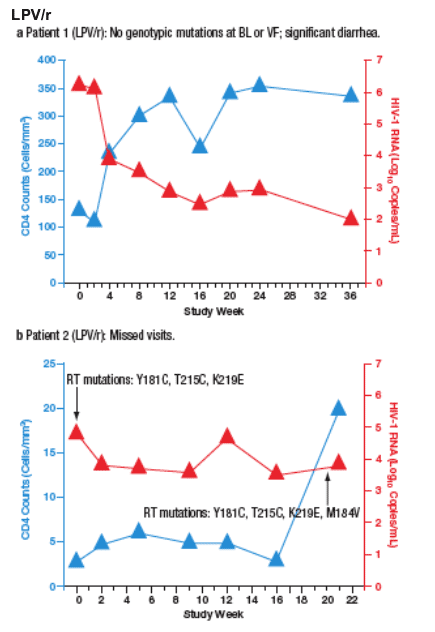
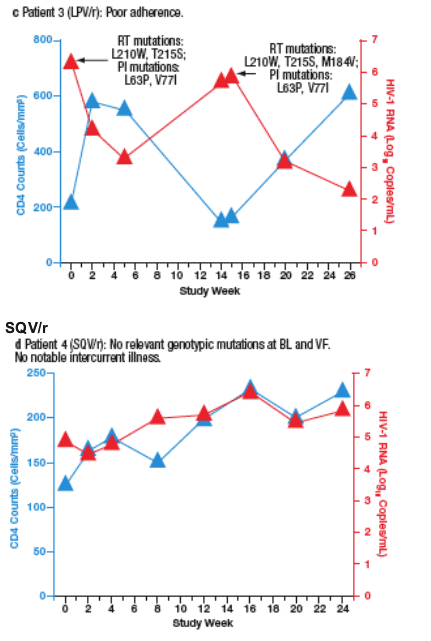
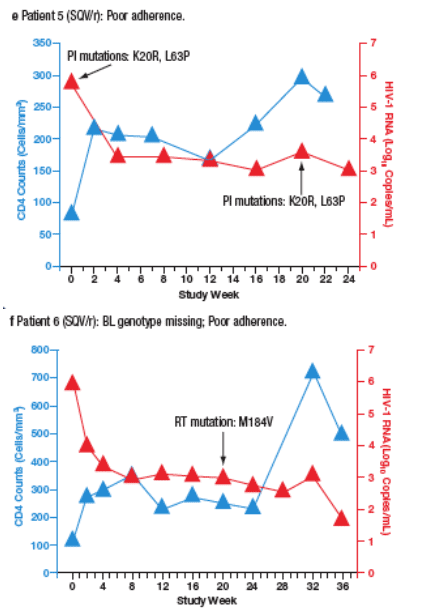
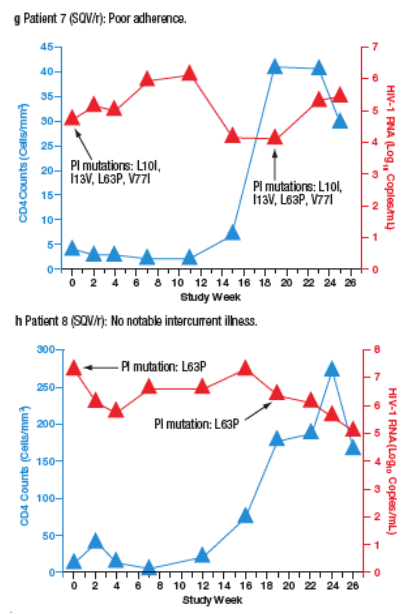
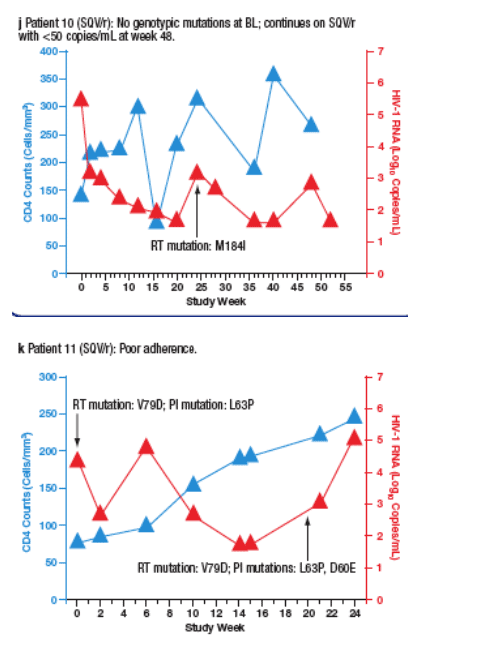
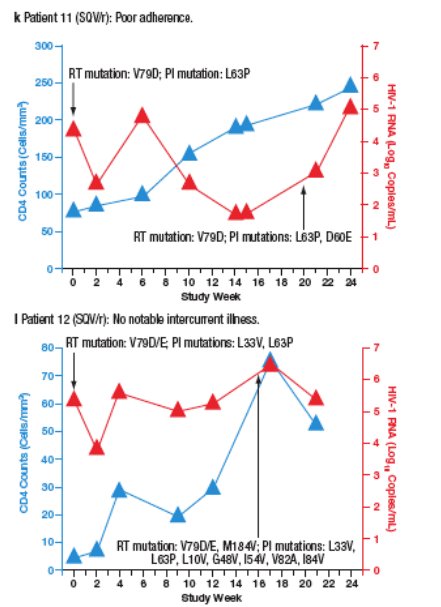
Virological failure (VF) was observed in 10 patients (6%) receiving SQV/r and 3 patients (1.8%) receiving LPV/r. Most VFs were related to adherence. Only 2 of the patients who developed VF (both in the SQV/r arm) developed new PI mutations during the study. The time course of viral load and CD4 cell count for each patient are plotted in Figure 4a-m.
Figure 4. The Time Course of Viral Load and CD4 Counts of Each
Patient who Experienced Virological Failure (VF) with LPV/r (a-c) and
SQV/r (d-m).
Reference
1. Hammer et al. JAMA 2006;296:827-843.
|
| |
|
 |
 |
|
|