 |
 |
 |
| |
Virologic Failure Predictors in SECOND-LINE Trial of Raltegravir vs NRTIs
|
| |
| |
Dowload the PDF here
Dowload the PDF here
20th International AIDS Conference, July 20-25, 2014, Melbourne
Mark Mascolini
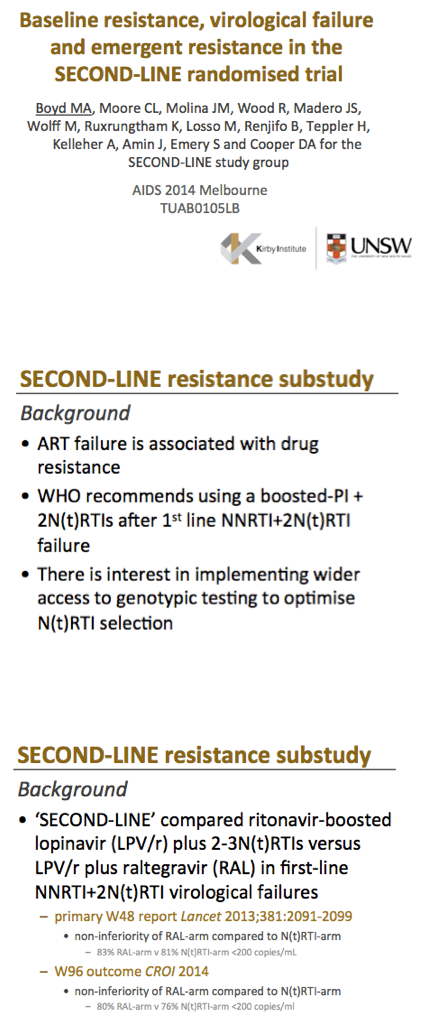
Less than perfect adherence, black or Hispanic race/ethnicity, high pretreatment viral load, and more nucleoside/nucleotide (NRTI) options by genotypic sensitivity score predicted virologic failure in the SECOND-LINE trial comparing raltegravir with two or three NRTIs (both with lopinavir/ritonavir) in people whose nonnucleoside regimen failed [1]. Among participants randomized to raltegravir who had genotyping after virologic failure, raltegravir-related mutations emerged in 20%.
SECOND-LINE compared raltegravir with two or three NRTIs as a component of second-line therapy in 541 people whose first-line nonnucleoside regimen failed [2]. Conducted at 37 sites worldwide, the trial found that the raltegravir regimen was not virologically inferior to the standard NRTI regimen in people also taking lopinavir/ritonavir. The SECOND-LINE team concluded that a protease inhibitor/raltegravir regimen "might extend the successful public health approach to management of HIV by providing simple, easy to administer, effective, safe, and tolerable second-line combination antiretroviral therapy."
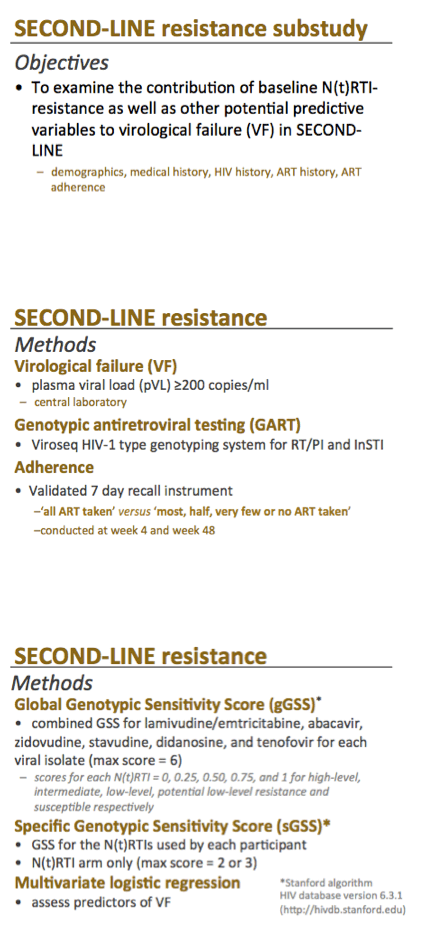
The new analysis assessed predictors of virologic failure (a viral load at or above 200 copies) and emergence of resistant virus in SECOND-LINE participants. With NRTI genotypic resistance assessed at a central lab, the investigators assigned a genotypic sensitivity score (GSS) to each regimen using the Stanford HIV database system. A higher GSS indicates more second-line options. A potential problem in interpreting GSS is that the score does not take into account potentially differing potencies of the antiretrovirals considered.
The SECOND-LINE team defined global GSS as the combined GSS for lamivudine or emtricitabine, abacavir, zidovudine, stavudine, didanosine, and tenofovir (maximum score 6). Specific GSS was the combined GSS for the two or three NRTIs used in each second-line regimen. The investigators measured adherence on a validated 7-day recall test comparing "all antiretrovirals taken" with "most, half, very few, or no antiretrovirals taken."
Median global GSS was 3.0 in both the NRTI arm and the raltegravir arm. Among trial participants analyzed, baseline global GSS was low in 251 people, moderate in 163, and high in 37. Distribution of low, moderate, and high baseline global GSS was similar in the NRTI arm and the raltegravir arm. Rates of virologic failure at week 96 were also similar in the NRTI arm and the raltegravir arm among people with a low baseline global GSS (9% and 14%), a moderate baseline global GSS (13% and 12%), and a high baseline global GSS (43% and 38%).
Median specific GSS measured 1.0 in the NRTI arm. Virologic failure rates stood at 8% in 67 people with low baseline specific GSS, 14% in 81 people with moderate baseline specific GSS, and 19% in 67 people with high baseline specific GSS.
Multivariate logistic regression analysis identified six independent predictors of virologic failure at the following adjusted odds ratios (aOR) (and 95% confidence intervals):
-- Less than complete adherence at week 4: aOR 2.18, 95% CI 1.07 to 4.47, P = 0.032
-- Less than complete adherence at week 48: aOR 3.48, 95% CI 1.09 to 5.69, P = 0.03
-- Baseline viral load above 100,000 copies: aOR 3.43, 95% CI 1.70 to 6.94, P < 0.001
-- Baseline global GSS 4.5 to 6 (vs 0 to 3.25): aOR 4.73, 95% CI 1.04 to 11.46, P = 0.002
-- Hispanic vs Asian ethnicity: aOR 3.13, 95% CI 1.21 to 9.13, P = 0.019
-- African vs Asian race: aOR 3.49, 95%CI 1.68 to 7.28, P = 0.0007
Among study participants with virologic failure and viral samples that could be genotyped, major NRTI mutations emerged in 8 of 64 people (12.5%) in the NRTI arm and 2 of 65 (3.1%) in the raltegravir arm. Major PI mutations emerged in 1 of 64 people (1.6%) in the NRTI arm and 0 of 65 in the raltegravir arm. Major integrase mutations emerged in 0 of 72 in the NRTI arm and 16 of 79 (20.3%) in the raltegravir arm.
The SECOND-LINE team believes their findings support "greater investment in research, understanding, and implementation of effective adherence interventions and support." It is unclear why a higher (better) baseline global GSS predicted virologic failure in this trial. One possibility is that people with a lower GSS--and hence fewer second-line NRTI options--adhered to their second-line regimen better, and worse adherence at treatment weeks 4 and 48 more than doubled chances of failure. Or the counterintuitive GSS association with virologic failure could point to shortcomings of GSS in predicting treatment success or failure.
References
1. Boyd M, Moore C, Molina JM, et al. Baseline resistance, virological failure and emergent resistance in the SECOND-LINE randomised trial. AIDS 2014. 20th International AIDS Conference. July 20-25, 2014. Melbourne. Abstract TUAB0105LB.
2. SECOND-LINE Study Group, Boyd MA, Kumarasamy N, Moore CL, et al.
Ritonavir-boosted lopinavir plus nucleoside or nucleotide reverse transcriptase inhibitors versus ritonavir-boosted lopinavir plus raltegravir for treatment of HIV-1 infection in adults with virological failure of a standard first-line ART regimen (SECOND-LINE): a randomised, open-label, non-inferiority study. Lancet. 2013;381:2091-2099.
http://www.ncbi.nlm.nih.gov/pubmed/23769235
--------------------------------------
CROI/2013: SECOND-LINE: Ritonavir-Boosted-Lopinavir with 2-3N(t)RTI or Raltegravir in
HIV-Positive Subjects Virologically
Failing First-Line NNRTI/2N(t)RTI antiretroviral therapy
http://www.natap.org/2013/CROI/croi_130.htm
Less Bone Loss With Raltegravir Than NRTIs in Second-Line Regimens
http://www.natap.org/2013/IAS/IAS_31.htm
The publications in The Lancet of the original study & the Commentary are attached
Commentary: ".....These findings are important because they show that the WHO-recommended second-line treatment is an efficacious rescue regimen. Furthermore, they suggest that the new regimen has equal efficacy, but with other potential advantages. First, use of a single treatment based on only two different compounds for all the patients failing first-line treatment will ease demand on drug supply and stocks. Second, simple regimens might enable treatment to be delivered by trained, but non-medical, health-care workers, improving access to HIV care in settings with limited resources.4 Third, because the rescue treatment consists of two drugs from antiretroviral classes to which patients have not been previously exposed, genotypic resistance testing is not needed, saving time, money, and effort. Finally, the raltegravir regimen is likely to cause fewer toxic effects than NtRTI-based treatments.....Although the SECOND-LINE study2 offers a simple approach to ensure that first-line and second-line regimens are from independent antiretroviral classes, a crucial problem in HIV treatment remains: how to define failure of a first-line regimen. The use of clinical or immunological criteria for virological failure lacks sensitivity and specificity and continued use of ineffective drugs could lead to the development of resistance, thus jeopardising the efficacy of NtRTIs in second-line treatment; conversely, the apparent absence of an immunological benefit of a virologically effective first-line treatment could lead to unnecessary switching to a more expensive second-line regimen. So, even if the best second-line treatment is identified in clinical trials, it would be difficult to apply without a widely available method for monitoring viral load.11, 12"
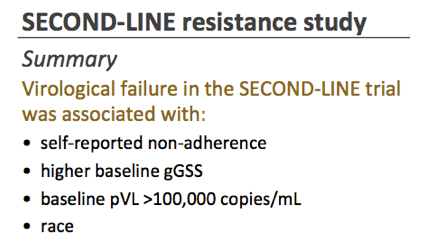
So in summary in this substudy of the SECOND-LINE randomised controlled trial we found that virological failure was associated with self-reported non-adherence, a higher baseline global genotypic sensitivity score, a baseline viral load of greater than 100,000 copies/mL and race.
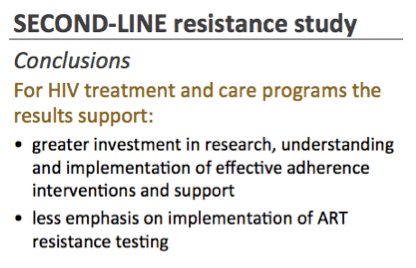
We believe that these findings have important implications for HIV treatment and care programs and support a greater emphasis on investment in research, understanding and implementation of effective adherence interventions and support and less emphasis on the implementation of complex and expensive resistance testing.
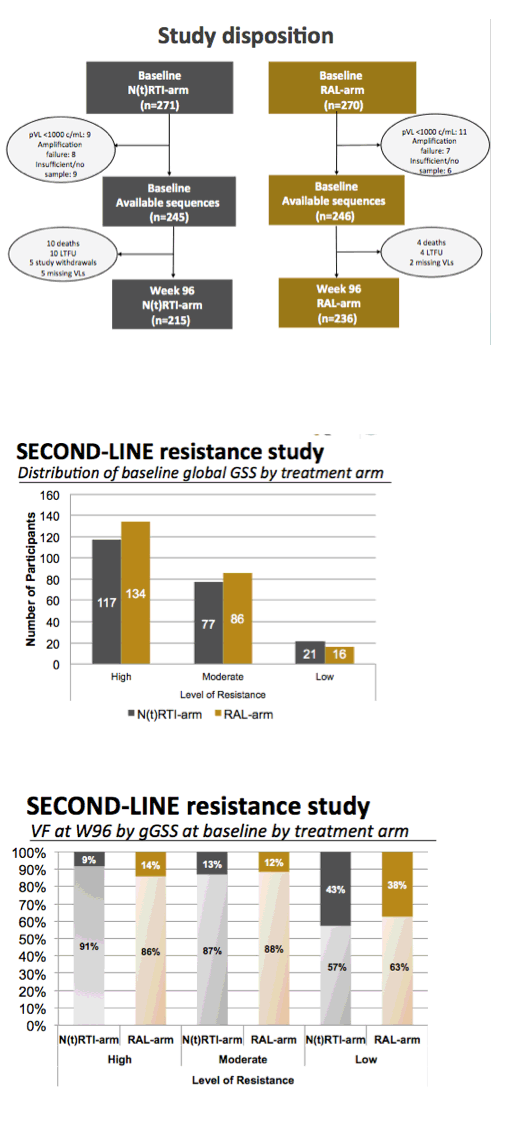
This figure expresses the relationship of degrees of baseline resistance to either virological success or failure.
What is most striking about this figure is that those participants who had the least degree of resistance to the backbone N(t)RTIs appear to have experienced a greater degree of failure compared to those with moderate or high levels of NRTI resistance.
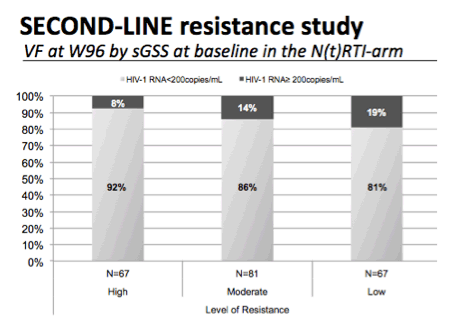
This slide shows the same relationship but in this case for the specific genotypic sensitivity score, that is the score reflecting the activity of the 2 or 3 N(t)RTIs used by each participant on study.
Once again there appears to be a relationship between a greater degree of virological failure in those with a only low levels of resistance to the N(t)RTIs.
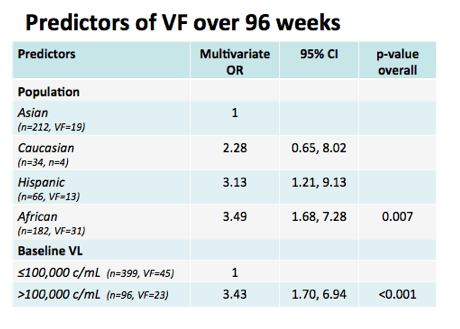
Now to the results form the logistic regression.
I am going to show you only those variables that retained significance in the multivariate model.
These were:
The population studied. So using Asian participants as the reference group we found that Caucasian, Hispanic and African participants were more likely to experience virological failure, and this reached statistical significance for the comparisons with Hispanic and African participants.
We also found a relationship for baseline viral load with those with a high viral load more likely to fail than those with a low viral load.
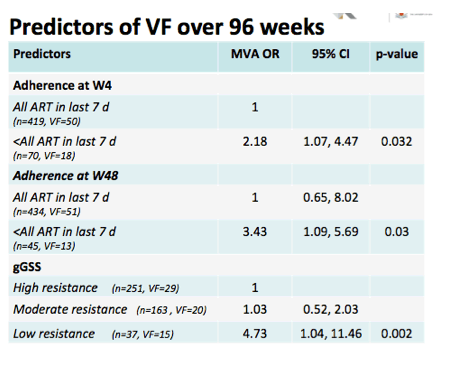
We found a significant relationship in the multivariate model for adherence to ART assessed both early at week 4 and late at week 48.
Finally we found a significant relationship between the global genotypic sensitivity score and virological failure which was significant for the comparison between those with the lowest score as the referent and the highest score, consistent with the distribution we saw in the earlier figure.
|
| |
|
 |
 |
|
|