| |
United Kingdom HIV Drug Resistance
|
| |
| |
Estimating HIV-1 Drug Resistance in Antiretroviral-Treated Individuals in the United Kingdom
The Journal of Infectious Diseases
Sept 15, 2005;192:967-973
UK Collaborative Group on HIV Drug Resistance
Good estimates of the prevalence of human immunodeficiency virus drug resistance are important for assessing requirements for new drug classes and modeling the spread of resistance. However, little consensus exists on optimal methodologies to generate such data. To compare methodologies, we used the national data set of resistance tests from >4000 patients in the United Kingdom performed between 1998 and 2002. When single-time-point analysis (method 1) was used, the proportion of tests with any form of resistance was -80%, with little time trend. When a cumulative model of resistance (method 2) was used and placed in the context of all treated patients, the prevalence of any resistance increased by year, reaching 17% of treated patients in 2002. Method 2 also nearly doubles estimates of numbers of individuals infected with multiclass drug-resistant virus. Our results identify an urgent need for new drugs within existing classes and new classes of antiretroviral therapy.
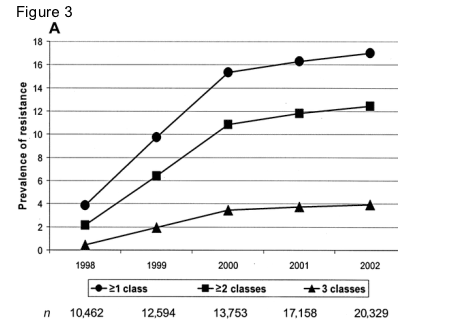
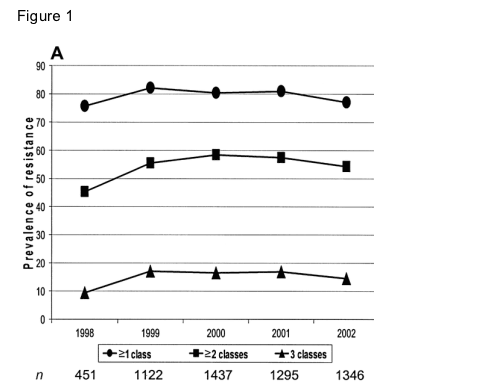
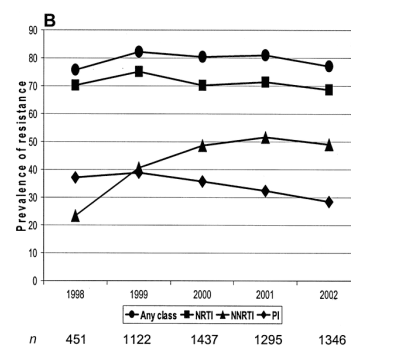
.....When method 1 was used (last test per patient per year among those with a resistance test in that year), the prevalence of resistance to >1 class remained fairly constant over time, between 75% and 82%....No time effect was apparent for the prevalence of resistance to >2 classes or to triple-class resistance, which reached 17% in 1999....Of patients who had resistance test in 1999, 39% had at least 1 major mutation associated with resistance to PIs, which decreased to 28% in 2002. Conversely, NNRTI resistance increased from 41% in 1999 to between 49% and 52% through 2000-2002......When method 2 (resistance accumulated over successive tests) was used, the absolute number of patients with resistance to any class of ART increased linearly, from 402 patients at the end of 1998 to 3460 patients at the end of 2002. Forty-five patients had resistance-associated mutations to all 3 classes of drugs detected in tests at the end of 1998; this increased to 797 patients at the end of 2002, representing both current and archived virus..... 17% resistant to 1 or more classes, 12% resistant to 2 or more classes, 4% resistant to 3 classes...
RESULTS
A total of 4218 patients were identified as having at least 1 resistance test while receiving therapy from 1998 to the end of 2002; 63% of the patients had information from 1 resistance test, 22% from 2 tests, and 15% from ⩾3 tests.
When method 1 (last test per patient per year among those with a resistance test in that year) was used, the prevalence of resistance to >1 class remained fairly constant over time, between 75% and 82% (figure 1A). No time effect was apparent for the prevalence of resistance to >2 classes or to triple-class resistance, which reached 17% in 1999. Almost all patients with resistance to any class had mutations associated with reduced susceptibility to NRTIs, occurring either alone or with PI and/or NNRTI mutations. Over time, the most frequent pattern of resistance to 2 classes changed from NRTI and PI resistance to NRTI and NNRTI resistance (figure 1B). Of patients who had resistance test in 1999, 39% had at least 1 major mutation associated with resistance to PIs, which decreased to 28% in 2002 (P < .001). Conversely, NNRTI resistance increased from 41% in 1999 to between 49% and 52% through 2000-2002 (P < .001).
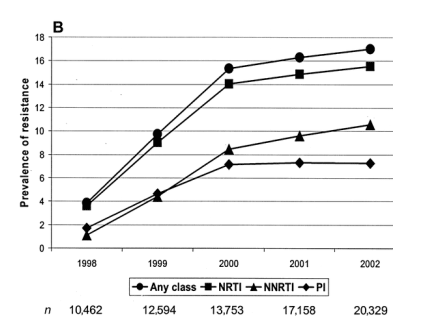
Estimates of the number of HIV-infected patients in the United Kingdom who were receiving treatment were 10,462 at the end of 1998, 12,594 at the end of 1999, 13,753 at the end of 2000, 17,158 at the end of 2001, and 20,329 at the end of 2002. When these figures were used as the denominators, with the number of individuals with resistance used as the numerator (method 2), the prevalence of resistance to any class of drugs was 4.5% at the end of 1998, which increased to 15.3% at the end of 2000 before it stabilized and reached 17.0% at the end of 2002 (figure 3A). Similar patterns over time were observed for resistance by class (figure 3B); NNRTI resistance was more prevalent than PI resistance.
Our prevalence estimates could represent an underestimate if resistance testing was not undertaken for all patients with possible resistance. To explore this within the United Kingdom, the number of tests performed at times of treatment switches during 1998-2002 was estimated for patients in the UK Collaborative HIV Cohort Study [16], whose resistance tests have been entered into the UK HIV Drug Resistance Database. A treatment switch was defined as a change in ⩾2 drugs in patients who had a viral load of ⩾1000 copies/mL within the 3 months preceding the switch. During 1999-2002, -30% of treatment switches in this cohort were preceded by a resistance test within 6 months (1999, 27%; 2000, 30%; 2001, 30%; 2002, 27%). Therefore, the figures that we provide on the prevalence of resistance as a proportion of treated patients are underestimates.
When method 2 (resistance accumulated over successive tests) was used, the absolute number of patients with resistance to any class of ART increased linearly, from 402 patients at the end of 1998 to 3460 patients at the end of 2002. Forty-five patients had resistance-associated mutations to all 3 classes of drugs detected in tests at the end of 1998; this increased to 797 patients at the end of 2002, representing both current and archived virus.
Within the data set as a whole, -15%-20% of NRTI resistance was due to the presence of M184V mutations occurring on their own. Because this mutation compromises lamivudine but no other NRTI, we separated lamivudine resistance (M184V mutation) and other NRTI-resistance mutations into 2 classes, creating 4 classes. According to the results of method 1, the prevalence of resistance to all 4 classes ranged between 5% and 8% over time, compared with 10%-17% when the 3-class definition was used. According to the results of method 2, the overall prevalence of resistance was again dominated by NRTI resistance, with estimates of NRTI resistance decreasing from 14%-16% by the end of 2000 to 11%-13% by the end of 2002 when the 4-class definition was used. Twenty-six patients had major mutations associated with reduced susceptibility to all 4 classes at the end of 1998; this increased to 471 at the end of 2002.
Method 2: prevalence of resistance by cumulative no. of drug classes compromised. The prevalence of resistance over time, using method 2 (accumulating resistance as a proportion of the total no. of treated patients) was classified by cumulative no. of drug classes compromised (A) and specific drug class (B). NNRTI, nonnucleoside reverse-transcriptase inhibitor; NRTI, nucleoside reverse-transcriptase inhibitor; PI, protease inhibitor.
Figure 3


Method 1: prevalence of resistance by cumulative no. of drug classes compromised. The prevalence of resistance over time, using method 1 (single-time-point analysis and proportion of tests undertaken), was classified by cumulative no. of drug classes compromised (A) and specific drug class (B). NNRTI, nonnucleoside reverse-transcriptase inhibitor; NRTI, nucleoside reverse-transcriptase inhibitor; PI, protease inhibitor.
Figure 1


DISCUSSION
There are currently >20 available antiretroviral drugs, of 3 classes (other than the recently licensed fusion inhibitor enfuvirtide). Despite the undoubted benefit conferred by triple-combination therapy, drug resistance can develop. Such resistance to 1 drug often leads to cross-resistance to others, which limits the long-term efficacy of treatment and future therapeutic options. The emergence and development of multiclass drug resistance is also a risk factor for HIV-related death [17]. This underlines the importance of population-based surveys of drug resistance. Most such studies are based on single test results per calendar unit, which therefore reflects a treatment-experienced population with a detectable plasma viral load. Of treated patients, these individuals are most at risk of transmission; therefore, such an analytic approach is informative as to the characteristics of potentially transmitted resistant viruses [18].
We have therefore developed another approach (method 2) that takes into consideration multiple resistance tests undertaken for individual patients and that uses as a denominator the total number of treated patients from which those with resistance tests derive. Such an approach is more appropriate for determining the absolute number of patients who have resistance to 1, 2, or 3 classes of drug, because it includes those in whom resistance has previously emerged but is kept under control by subsequent drug regimens (but which may reemerge at the time of next viral rebound). It is also informative for estimating the prevalence and patterns of resistance in viruses among all treated patients during their follow-up. The proportion of patients with resistance is much lower as a proportion of all treated patients (method 2) than as proportion of all tests (method 1), because therapy is generally successful at suppressing viral replication [19] and, thus, reducing the emergence of resistance. Nevertheless, some striking differences in time trends are noted between our 2 methods of analysis. Taking into account the accumulation of resistance within individuals over time, the overall burden of resistance to each drug class is increasing, both as absolute numbers and as proportions of treated patients, which was not seen when method 1 was used. Of particular note is the more recent increase in NNRTI resistance, which now exceeds PI resistance by -50%, whichever analysis method is used. This correlates with changing prescribing patterns [20] and illustrates the close relationship between drug use and the emergence of resistance. Furthermore, the genetic barrier to resistance differs significantly between drugs-PI resistance is far less likely than NNRTI resistance after treatment with the respective drugs in a triple-therapy regimen, particularly with a ritonavir-boosted, PI-containing regimen [2, 21, 22]. Thus, PI resistance remains low, compared with resistance to other classes over the whole time period studied.
We acknowledge that even this approach has a number of limitations. First, the denominator should take into account different lines of therapies received (i.e., first, second, or third line), because the risk of virological failure (reflected in our numerator) increases with more drug experience [23]. Such analyses are best undertaken within specific clinical cohort studies. Second, we have not considered death in our analysis, which would lead to patients dropping out of the numerator over time. We note that patients with multiclass drug resistance represented only a very small proportion of HIV-related deaths in a cohort similar to that in the present study [24], which suggests that this issue does not lead to significant bias. However, the actual number of resistance tests undertaken per year remained quite similar between 1999 and 2002, which suggests that increasing resistance, as defined by method 2, is not due to changes in thresholds for testing.
In summary, we have applied a new method of analysis to the UK HIV Drug Resistance Database, to estimate the changing prevalence of resistance over time. During 2002, these figures ranged from 17% of patients with resistance to drugs within ⩾1 class to 4% with resistance to drugs within all classes; this represents 500-800 patients with multiclass drug resistance in the United Kingdom in 2003.
It is important to recognize that our figures likely represent an underestimate of the burden of resistance in the treated population. Only 30% of those switching therapy are estimated to have had a resistance test undertaken. Furthermore, resistance testing is very rare in patients with viremia who do not switch treatment, and we know that resistance may emerge at viral loads below that required for successful testing.
We demonstrate that the majority of treated patients do not have drug resistance, because of effective suppression of viral replication. Nevertheless, our data underline the urgent need for new classes of antiretroviral drugs to prevent disease progression in the growing number of individuals with resistance. In addition, newer drugs and therapeutic strategies within existing classes-such as second-generation NNRTIs [25] and pharmacologically boosted PI drug levels [26]-will play an increasing role in overcoming drug resistance.
INTRODUCTION
Antiretroviral therapy (ART) is very successful in reducing progression to AIDS and death [1]. However, in a minority of patients, drug-resistant viruses can emerge, and these represent a significant limitation to the long-term effectiveness of highly active ART in those individuals [2]. Such resistance often develops in association with a rebound in plasma viral load in patients receiving ART, and viral gene sequence-based resistance testing is used to guide subsequent treatment choices. More than 50 drug resistance-associated mutations have been identified that, either alone or in combination, confer variable resistance to ⩾1 drug within a specific class [3]. Thus, resistance testing is an important diagnostic tool for guiding optimal treatment in this group of patients [4].
It is important to undertake population-based estimations of HIV drug resistance in drug-experienced patients, for 2 reasons. First, individuals with resistance may transmit these viruses to others [5-7]. Second, the requirement for new classes of drugs for those patients infected with multiclass drug-resistant virus must be determined.
To date, most such estimates have been produced by identifying the prevalence of resistance in large numbers of tests undertaken for routine clinical purposes; these typically yield prevalence rates of any form of resistance of 70%-80% [8-10]. However, there are 2 major flaws in this approach. The biased nature of specimens analyzed (only those sent for resistance testing are tested by clinicians) makes it difficult to extrapolate these outcomes to the population as a whole; because the majority of treated patients have successful suppression of viral replication and clinical benefit, resistance should be placed in the context of all such individuals, to provide a realistic assessment of the burden within the infected population. In addition, data based on single test results do not reflect the possible cumulative resistance that may occur over time and resistant virus that remains archived within the body [11].
One of the few studies to have addressed resistance in the context of an appropriate denominator for an estimation of prevalence-the Health Service Cost and Utilization Study-estimated that 76% of patients with viremia in a US cohort in 1998 had resistance to ⩾1 antiretroviral drug, which translates to 48% of the treated population [12]. In view of the importance of such estimates for characterizing the burden of resistance, we have used a number of methodological approaches to derive key parameters in the UK infected population using data collected in the UK HIV Drug Resistance Database and in the Survey of Prevalent Diagnosed HIV Infections (SOPHID) [13].
METHODS
The UK HIV Drug Resistance Database aims to pool the results of all resistance tests performed as part of routine clinical care in the United Kingdom; to date, it contains data from -85% of HIV drug-resistance tests performed in the United Kingdom. Patients >16 years old, who had at least 1 genotypic resistance test (excluding tests with partial or complete polymerase chain reaction failure) after starting ART during 1998-2002, were identified from the database. For all analyses, resistance to a class of drugs was defined as at least 1 major mutation associated with reduced susceptibility to a drug in that class according to the International AIDS Society-USA (2003) list [3]. The classes described are nucleoside reverse-transcriptase inhibitors (NRTIs), nonnucleoside reverse-transcriptase inhibitors (NNRTIs), and protease inhibitors (PIs). Any classification of HIV drug resistance within large data sets is liable to oversimplification, given the immense complexity of the effects of single and multiple mutations on drug susceptibilities (phenotype) and on clinical responses. For NRTIs and PIs, in particular, individual mutations may not confer complete, or even partial, cross-resistance to other drugs within the same class; therefore, the classification of "class resistance" may overestimate the actual burden of resistance. For instance, the mutation M184V in reverse transcriptase only compromises lamivudine (and the recently approved analogue emtricitabine) [14], but it may hypersensitize HIV to other drugs. Similarly, the D30N mutation in protease only compromises nelfinavir within its class (in vitro). Because the M184V mutation represents the most prevalent single mutation within our data set, it has the capacity to seriously bias our analysis if it is ascribed as a nucleoside-analogue class mutation, so we have considered it to be a fourth class of mutation. Thus, in addition to defining resistance by the more standard 3 classes, we also analyzed data by 4 classes, whereby the presence of M184V plus other NRTI mutations represent 2 classes of resistance. Finally, because the fusion inhibitor enfuvirtide was licensed only in mid-2003 and resistance testing for this drug is rarely undertaken (although resistance is well documented) [15], we did not address resistance to this drug.
The prevalence of resistance was estimated by 2 methods. Method 1 was a cross-sectional analysis as used conventionally, utilizing the results obtained from 1 test per patient within a given calendar period. If a patient had >1 test in a calendar period, the results from the last test during that period were used. The prevalence of resistance was estimated as the proportion of patients with resistance among those who had at least 1 test in the time period.
As was mentioned above, method 1 does not take into account the fact that some patients may have developed and archived resistance from previous drug regimens. Therefore, an alternative approach (method 2) considered resistance up to the end of a given calendar period. This gave an estimate of the absolute number of patients with resistance during that time period. For example, consider a patient who had a resistance test in 1997 in which major NRTI mutations were detected and then had another test in 1999, in which major PI mutations were detected. This patient would be counted as having NRTI resistance by the end of 1997 and 1998 and both NRTI and PI resistance by the end of 1999 and afterward. This method therefore cumulates both current and archived resistance. Method 1 would have counted this patient as having only NRTI resistance in 1997 and PI resistance in 1999, with no resistance during any other time period. It was assumed all patients remained alive until the end of 2002.
The population of the UK HIV Drug Resistance Database (patients in the United Kingdom with at least 1 resistance test) does not provide a natural denominator to estimate the prevalence of resistance for method 2; estimates of the number of HIV-infected patients receiving treatment in the United Kingdom were obtained from SOPHID [13]. SOPHID obtains reports of all individuals in England, Wales, and Northern Ireland who have received diagnoses of HIV and who received HIV-related treatment or care within the previous calendar year. Cross-validation with other national surveillance schemes-such as the HIV diagnosis and AIDS reporting systems-demonstrates the high level of reporting to SOPHID. Indeed, the most significant underreporting occurs in the 2%-3% of patients who seek their HIV care outside of the National Health Service. We therefore inflated the estimates by a factor of 1.052, to account for the number of HIV-infected patients in Scotland, based on 2002 data [13].
|
|
| |
| |
|
|
|