| |
Cost-Effectiveness of Enfuvirtide in HIV
Therapy for Treatment-Experienced Patients in the United States
|
| |
| |
AIDS RESEARCH AND HUMAN RETROVIRUSES
Volume 22, Number 3, March 2006, pp. 240-247
JOHN HORNBERGER,1-3 J. MICHAEL KILBY,4 NEIL WINTFELD,5 and JESSE GREEN5
1The SPHERE Institute/Acumen, Burlingame, California.
2Department of Veteran Affairs, Palo Alto, California.
3Stanford University School of Medicine, Stanford, California.
4University of Alabama, Birmingham, Alabama.
5Roche, Nutley, New Jersey.
While the cost-effectiveness of antiretroviral therapy in HIV is well established,22-24 the present modeling was conducted because ENF is the first in a new class of ARVs and is associated with higher costs than other available antiretrovirals. We developed a mathematical model of disease progression for
treatment-experienced HIV-1-infected patients on either ENF plus OB or OB alone. Our analysis had two objectives: (1) to project the impact of virological and immunological response biomarkers found in the analyses of the TORO trials on longterm clinical prognosis; (2) to estimate the cost-effectiveness of ENF OB versus OB alone as measured in cost per life year and cost per quality-adjusted life-year (QALY) saved.
ABSTRACT
Enfuvirtide (ENF) is the first of a new class of antiretrovirals (ARVs) known as the HIV fusion inhibitors. Two phase III studies of ENF, TORO 1 and TORO 2, demonstrated that ENF given in combination with optimized background (OB) therapy significantly improved virological response, increased the time to virological failure, and increased CD4-cell count compared with OB alone among highly treatment-experienced patients.
The present study investigated the long-term clinical outcomes, costs, and cost-effectiveness of ENF. Outcomes, costs, and cost-effectiveness were estimated using a Markov model. Viral suppression and immune reconstitution were determined from the outcomes of the clinical trials. Time to immunological failure, time to AIDS-defining event (ADE), and time to death were estimated based on published mathematical models of disease progression. Costs were based on published estimates of the use and costs of ARVs, cost of managing
ADEs, and cost of laboratory and other outpatient services. Cost-effectiveness was calculated as the incremental cost per year of life gained, adjusted for quality of life.
The combined effects of an increase in CD4 count and delayed time to virological and immunological failure with ENF + OB were predicted to produce
a mean life expectancy of 7.4 years from initiation of therapy, which was 1.8 years (1.5 quality-adjusted lifeyears [QALYs]) greater than the life expectancy associated with OB alone.
The incremental cost-effectiveness of ENF + OB was estimated to be $24,604 per QALY. ENF is projected to increase time to immunological failure, delay onset of new AIDS-defining events, and increase life expectancy by more than 1.5 years among treatment-experienced HIV-infected patients. The cost-effectiveness of ENF is comparable to many existing treatment and prevention management strategies for HIV.
RESULTS
Clinical prognosis
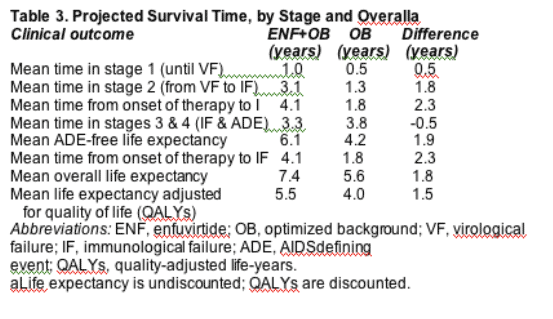
Patients in the ENF OB group were projected to experience a mean time until VF of 1.0 year compared with 0.5 year for OB only (Table 3). The combination of a longer time to VF and a greater rate of increase in CD4-cell count with ENF+OB
resulted in a higher peak CD4 count (290 cells/mm3) versus OB alone (212 cells/mm3) (Fig. 2). Following VF, the time until IF was projected to be longer in the ENF OB group than the OB group (3.1 years versus 1.3 years). The total time from onset of therapy until the CD4-cell count returned to baseline (IF) was 4.1 years with ENF OB and 1.8 years with OB. Treatment with ENF+OB versus OB resulted in a longer average time to an ADE (by 1.9 years) and increased life expectancy (by 1.8 years and 1.5 QALYs) for patients receiving ENF OB.
Costs and cost-effectiveness
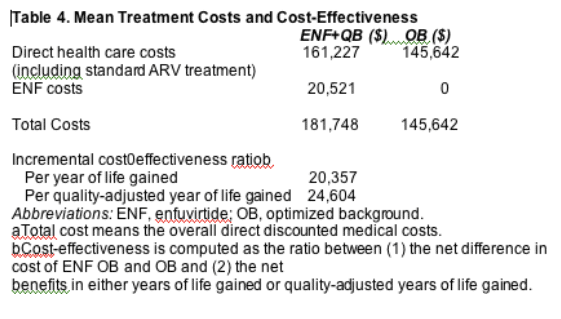
The total cost of medical care was forecast to be higher (by $36,106) with ENF+OB ($181,748) than with OB ($145,642) (Table 4) over the 10-year period of the model. This cost difference stems from two sources. The first was the cost of ENF itself ($20,521). This was based on the monthly cost of ENF ($1764) times duration of therapy until VF (12 months) for $21,168, which after discounting was $20,521. The second source was the additional medical costs associated with 1.8 years of additional life expectancy in the ENF OB group, which was $15,584. For ENF OB, the incremental cost-effectiveness
ratio (per additional year of life expectancy) was $20,357, and $24,604 (per additional QALY).
Sensitivity and subgroup analyses
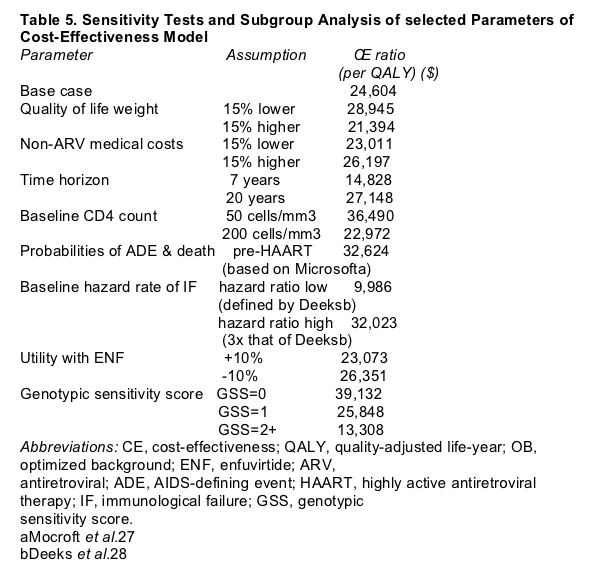
One-way sensitivity analysis showed that the cost-effectiveness ratio is most sensitive to assumptions about baseline CD4-cell count and baseline hazard of IF (Table 5). Altering the baseline hazard of IF by 50% (same risk of IF as in the cohort of Deeks et al.)28 or 150% resulted in a 59% reduction and a 30% increase respectively in the cost-effectiveness ratio per QALY. Altering the baseline CD4-cell count from 133 to 50 produced a 48% increase in the cost-effectiveness ratio per QALY. Using pre-HAART or early-HAART (rather than late- HAART) data on risk of ADE and death had a more modest effect: 33 and 26% increases in cost per QALY, respectively.
On the basis of subgroup analysis, the model indicated that clinical and economic outcomes varied with the levels of resistance to the ARVs in the background regimen (as measured by GSS). Incremental QALYs gained with ENF+OB versus OB ranged from 0.8 year for patients who were resistant to all
of the ARVs in their background regimen (GSS = 0) to 2.4 years for patients who were infected with a virus that was sensitive to two or more background ARVs (GSS >/= 2). The cost-effectiveness ratio was $13,308 per QALY when the virus was sensitive to at least two ARVs (GSS >/= 2) and reached a high of $39,132 per QALY when the virus lacked sensitivity to all drugs in the background regime (GSS=0).
DISCUSSION
The past 20 years have seen remarkable scientific innovations in the treatment of HIV. Widespread access to ARV therapy has enabled people living with HIV to lead longer and healthier lives. Unfortunately, there are signs that these positive
trends are becoming increasingly difficult to sustain. In 2001, scientists reported that one in every seven Americans newly infected with HIV had a strain of the virus that was resistant to at least one drug for HIV.17,37 Over time, patients who
have experienced multiple regimens may develop viral resistance to most, if not all, available treatment options. In this group of patients there is a need for agents with new mechanisms of action that are effective against resistant viral strains. ENF is the first clinically available agent in the new class of viral entry inhibitors. In randomized controlled trials, ENF in combination with OB therapy has been shown to benefit patients infected with HIV-1 who are highly ARV experienced, resulting in significantly greater viral suppression, longer time to virological failure, and greater increase in CD4-cell counts. ENF+OB is predicted to increase time to immunological failure, delay onset of new AIDS-defining
events, and increase overall life expectancy by more than 1.5 years, resulting in a cost-effectiveness ratio of approximately $25,000 per quality-adjusted year of life saved. Sensitivity analyses also revealed that among treatment-experienced patients, a higher baseline level of CD4-cell count is likely to be associated with more cost-effective outcomes. Moreover, the subgroup analysis indicated that the cost-effectiveness of ENF was as low as $13,308 among patients who still had two or more ARVs (in addition to ENF) to which the virus was sensitive at baseline. One previous publication38 addressed the cost effectiveness of ENF+OB in treatment-experienced patients. That study reported a cost-effectiveness ratio ($69,500 per QALY) that differed from the findings herein for several reasons. First, the previous publication defined the efficacy of ENF+OB as the percentage of patients with undetectable viral load, while the
model described here followed the TORO trial definition (log10 drop in viral load). Deeks et al.28 have demonstrated the beneficial impact of viral suppression even in the absence of undetectable viral load on the time to virological failure. Second, the prognosis after virological failure used in the previous publication
was based on historical untreated controls from the pre-HAART era, while the current model utilized HAART era prognosis as described by Mocroft et al.27 and Deeks et al.28 Finally, the previous publication assumed patients would be treated with ENF until viral load returned to baseline, a longer period (and higher cost) than the 48-week treatment period used by the clinical trial and incorporated into the current model. Nevertheless, these authors concluded that the cost-effectiveness of ENF in their study falls within the realm of accepted interventions in the United States.
The model presented here assumes that patients discontinued ENF therapy at VF, an average duration of 12 months. Data from a follow-up study of TORO trial patients who remained on ENF+OB beyond 12 months (up to 96 weeks) have been presented.39 Mortality among these patients at week 96 was less
than 1%. The model predicted 2.9% mortality at week 96. The model's projection of the mean CD4-cell count at week 96 was 248 while the patients in the follow-up study had a mean CD4 count of 326. This suggests that the model estimates of outcomes may be conservative and that continuing ENF therapy after virological failure may continue to improve prognosis.
When interpreting gains in life expectancy attributed to new therapeutic agents, it is informative to compare the estimates with other established medical interventions. Wright and Weinstein40 published a summary of the expected mean increases in life expectancy that could be attributed to selected medical interventions. Important interventions in HIV such as prophylaxis against PCP and toxoplasmosis were estimated to add approximately 5.3 months of life, on average. Widely used treatments for certain life-threatening conditions including chemotherapy in small-cell lung cancer, ticlopidine for stroke risk, or tissue plasminogen activator for myocardial infarction reportedly increased life expectancy by 7.4, 0.6, and 15 months, respectively. Wright and Weinstein40 reported only one intervention (implantable defibrillator for arrhythmia) with an expected mean survival benefit of 3.4 years that exceeded the estimated
improvement in life expectancy of 1.5 years reported in the present study of ENF.
Limitations
Several caveats are important to consider when assessing the conclusions of this study. As in almost all economic assessments of HIV therapy, we projected findings of a randomized trial to determine the implications over a longer time
period. While this is an accepted practice in economic analyses, 41 the effects found in a clinical trial apply to patients meeting the trial criteria and under trial conditions and caution must be used in extrapolating to less rigorously controlled practice environments. Further evaluations will be useful in determining
the effects of ENF outside highly controlled research settings.
Conclusion
In summary, this ENF cost-effectiveness analysis is based on published economic principles41 and is predicated on a history of HIV economic modeling in which it is common to extrapolate long-term outcomes (patient and economic) from findings of clinical trials with HIV biomarkers as endpoints. On the basis of the findings of the TORO trials, the model predicts a sustained increase in CD4-cell count, which is then associated with a favorable prognosis in delaying onset of an ADE and death. The added costs estimated for ENF are related not only
to its acquisition cost, but also to patients living longer and continuing to receive ARV therapy and other medical care. ENF is projected to significantly increase life expectancy in comparison with many available medical treatments, and has a
cost-effectiveness ratio that is comparable with many well-established medical interventions.
MATERIALS AND METHODS
A Markov model was developed to simulate the effect of therapy with ENF OB or OB on a representative patient's time to AIDS-defining event (ADE), life expectancy, health-related quality of life (HRQoL), and direct medical costs.25-26 The model linked the major clinical trial endpoints at week 48 (virological
failure, change in viral load, and change in CD4-cell count from baseline) to subsequent clinical progression (ADEs and mortality), using published mathematical models of disease progression produced during the HAART era.27-28 Other published sources (described below) were used to make adjustments for HRQoL and to allow computation of medical care costs.
The reference patient in the model had the mean baseline characteristics
of the patients enrolled in the trials: age (43 years), CD4 count (133 cells/mm3), and HIV-1 viral load (5.1 log10 HIV-1 RNA copies/ml).
The structure of the Markov model is illustrated in Fig. 1. The patient may have an initial response to treatment (stage I). Thereafter, the patient may progress to virological failure (VF) (stage II) and/or immunological failure (IF) (stage III; see definition of IF below). At any time, regardless of whether VF has occurred, the patient may progress to an ADE (stage IV) or death (stage V). Monthly transition probabilities to VF were derived from the clinical trial data,20,21 whereas the literature was searched and analyzed to find appropriate transition probabilities
to IF, ADE, and death in highly treatment-experienced patients.
Virological failure
VF was defined by the clinical trial protocol as meeting at least one of the following conditions: (1) HIV-1 RNA level <0.5 log10 copies/ml decrease from baseline by week 8; (2) HIV-1 RNA level <1.0 log10 copies/ml decrease from baseline by week 16; (3) HIV-1 RNA level >/= 2.0 log10 copies/ml decrease from baseline and HIV-1 RNA level rebound >1.0 log10 after week 8.
The probabilities of VF in the model during the first 12 months were based on the observed, treatment-specific VF rates in the trials. After 2 months of treatment, the cumulative VF rates were 17.5% in the ENF OB arm and 36.8% in the OB arm. During months 3-12 the average monthly failure rate was 3.9% in the ENF OB arm and 4.6% in the OB arm. These latter mean monthly failure rates for each arm were assumed to continue for the period subsequent to the 12-month
trial period.
Modeling CD4-cell count
The initial CD4-cell count for both treatment groups was set to the mean baseline value observed in the TORO trials (133 cells/mm3). After initiating therapy and prior to VF, the monthly change in the CD4-cell count in each treatment group equaled that observed in the clinical trials.
After VF (stage II), the CD4-cell count was assumed to decline at a rate that depended on the amount of viral suppression attained during therapy. The relationship of viral suppression to the decline in CD4-cell count following VF was based on a study by Deeks et al.,28 which enrolled 291 patients who experienced VF on a protease inhibitor (PI)-based regimen and had an increase in their CD4-cell count while on therapy. Deeks et al.28 examined the time between VF and the return of the CD4-cell count to its baseline value (IF). Overall, patients enrolled in the study by Deeks et al.28 experienced IF a median
of 3 years after VF. Deeks et al.28 also found that the length of time between VF and IF was directly correlated with the amount of reduction in HIV RNA (log10 scale) that had occurred during treatment.
In the TORO studies, the log10 change from baseline at week 48 in viral RNA was significantly less in the OB arm than in the ENF OB arm (-0.63 versus -1.48, p <0.0001).29 Given this difference in viral suppression, the data from Deeks et al.28 imply that patients failing the ENF OB regimen would be expected
to take a longer time to reach IF than those failing OB. The projected time to IF for each treatment group was determined by the specific hazard coefficient in the Deeks model associated with the drop in viral load for that group. In applying
findings from the study by Deeks et al.,28 we assumed that the baseline hazard rate for IF would be greater for the highly treatment-experienced patients participating in the TORO trials than for the patients studied by Deeks et al.28 Therefore we doubled the baseline hazard rate of IF found in the Deeks model and varied this rate extensively in sensitivity analyses.
After IF, the CD4-cell count was projected to further decline (below baseline) at a rate determined from an equation by Cook et al. based on data from the Multicenter AIDS Cohort Study (MACS).30 Since the MACS cohort data came from the pre-ARV era, this assumption is equivalent to assuming that these
patients no longer benefit from the efficacy of the study regimens. Cook et al. found that the annual rate of decline in the square root of the CD4-cell count was a function of the baseline viral load.30
Clinical progression
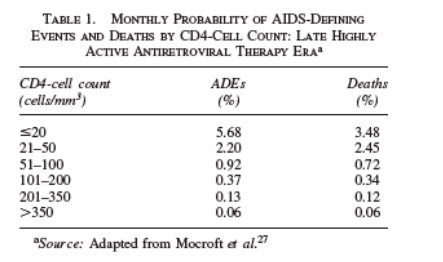
The probabilities associated with progression to ADE or to death are determined by the patient's CD4-cell count during any given month. The rates of ADEs and death used in the model were based on the experience of the EuroSIDA cohort.
This cohort consists of 9803 patients in 70 European HIV centers. Incidence rates of ADEs and death by CD4-cell count have been reported for this cohort in three treatment eras (pre-HAART, 1994-1995; early HAART, 1996-1997; and late HAART, 1998-2002).30 We applied the rates from the late-HAART era in the model (Table 1). However, to account for the possibility that risk of ADE and death might be higher in the treatment-experienced TORO patients than in EuroSIDA, we conducted sensitivity analyses using the more rapid rates of
clinical progression by CD4-cell count that were observed in the EuroSIDA cohort in the pre-HAART era.
Medical costs
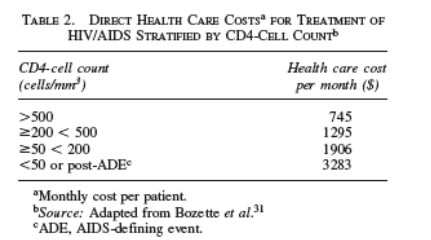
Our analysis used the perspective of the U.S. health care system. We utilized estimates of the medical costs of HIV care reported by Bozzette et al.31 These estimates consist of the reported health care resource utilization of a national probability sample of HIV patients in the United States and reflect inpatient
and outpatient medical services and medications. The monthly costs incurred by this cohort were stratified by CD4-cell count and are presented in Table 2. Costs were adjusted for inflation to 2004 dollars, using the medical care portion of the
consumer price index. In the model, monthly costs were assigned on the basis of the CD4 count until an ADE occurred; after an ADE the monthly cost was based on the CD4 0-50 cells/mm3 category. Patients in the OB arm incurred no cost for
ENF while those in the OB ENF arm incurred the additional cost of ENF (monthly wholesale acquisition cost, $1764)32 for the duration of ENF therapy.
Duration of therapy
As noted, the cost-effectiveness analysis presented here is based on the efficacy results of the TORO trials. The trials were designed to permit patients with VF to revise their regimens, and the primary, preplanned analysis of the TORO trials provided a comparison of the impact of ENF OB versus OB until VF.20,21 Accordingly, as this is a trial-based analysis, the scenario examined by our model assumed that ENF was given until VF and subsequently discontinued.
Quality of life
As in other published models of HIV therapy, we assigned quality-of-life scores (utilities) based on a 0-1 scale (0 for deathand 1 for quality of life of perfect or best attainable health). On the basis of the literature,33 specific utility scores were assigned as follows to ranges based on CD4-cell count without an ADE:
0-50 cells/mm3, 0.79; 51-100 cells/mm3, 0.81; 101-200 cells/mm3, 0.87; >200 cells/mm3, 0.94 and patients experiencing an ADE were assigned a score of 0.60.
Patients enrolled in the TORO trials completed the MOSHIV (Medical Outcomes Study HIV) questionnaire.34 At week 48, the addition of ENF to OB had no negative effect on quality of life.35 Therefore apart from the effect of ENF on increasing CD4-cell count, which tends to improve quality of life, we assumed no direct effect of administration of ENF on quality of life.
Other assumptions of the economic appraisal
The model followed outcomes and costs for the representative patient up to a time horizon of 10 years. Quality-adjusted life-years (QALYs) and costs were discounted at a fixed annual rate of 3%,36 while life-years were not discounted. Cost-effectiveness was computed as the incremental cost per QALY saved, based on published guidelines. To compare ENF+OB with OB we calculated the incremental cost-effectiveness ratio. This ratio was calculated by dividing the difference in total medical care costs between ENF+OB and OB patients by
the difference in QALYs between ENF+OB and OB patients.
Subgroup and sensitivity analyses
Using one-way sensitivity analyses, we varied treatment effectiveness,
relevant progression probabilities, discount rates, medical care costs, time horizon, and utilities to evaluate uncertainty in model parameters (see Table 5 for ranges used in the sensitivity analyses). Among the tests on utilities we varied
the utility scores during the ENF treatment period by +/-10% to consider the immediate effect of ENF on QOL. We conducted a subgroup analysis of the effect of using ENF when the virus has varying genotypic sensitivity to ARVs. The genotypic sensitivity score (GSS) was defined as the total number of drugs
in the OB regimen to which a patient's viral isolate showed genotypic sensitivity (exclusive of ENF).
Role of the funding source
The development of the model and the subsequent analyses were supported by a grant from Roche. The sponsors of the study had no role in the model design, cost-effectiveness analysis, and interpretation of the results, with the exception of the company coauthors who participated in all aspects of the study. All investigators had unlimited access to the model and data. No limitations on publication were imposed. The noncompany authors made the final decisions on all aspects of the manuscript.
|
|
| |
| |
|
|
|