| |
Efavirenz More Potent Than Abacavir in HAART, observational cohort study finds
|
| |
| |
".....We conducted a multicohort prospective observational study of human immunodeficiency virus-infected patients who had attained viral loads <80 copies/mL while receiving cART, without having previously received antiretrovirals. The rates of virological rebound, therapy failure, and lipid-level alteration during follow-up were calculated as the number of events divided by person-years of follow-up (PYFU). A multivariable analysis was performed using a Poisson regression model...... There was a total of 854 PYFU spent receiving efavirenz and 285 spent receiving abacavir. The nucleoside reverse-transcriptase inhibitor pairs most frequently used were zidovudine/lamivudine (66% of PYFU), stavudine/lamivudine (17.6%), and stavudine/didanosine (5.4%).....The adjusted relative rates of virological failure and therapy failure for abacavir, compared with those for efavirenz, were 2.17 (95% confidence interval [CI], 1.12-4.18; P = .02) and 1.41 (95% CI, 1.01-2.01; P = .05), respectively....."
"A Comparison between Abacavir and Efavirenz as the Third Drug Used in Combination with a Background Therapy Regimen of 2 Nucleoside Reverse-Transcriptase Inhibitors in Patients with Initially Suppressed Viral Loads"
The Journal of Infectious Diseases July 1, 2006;194:20-28
Alessandro Cozzi-Lepri, Andrea De Luca, Andrew N. Phillips, Marco Bongiovanni, Simona Di Giambenedetto, Maurizio Mena, Maria Cristina Moioli, Massimo Arlotti, Laura Sighinolfi, Pasquale Narciso, Miriam Lichtner, Roberto Cauda, and Antonella d'Arminio Monforte,a for the ICoNA Study Group,a the UCSC-Roma HIV Cohort Study Group,a and the IMIT Study Groupa
Confirmed rebound in viral load to >400 copies/mL in patients who had initially achieved viral suppression while receiving a combination antiretroviral therapy (cART) regimen occurs relatively frequently [1]. A number of factors associated with an increased risk of viral rebound have been identified: the use of suboptimal nucleoside reverse-transcriptase inhibitor (NRTI)-containing therapy before potent cART [2-7], the use of saquinavir (hard gel capsule formulation) [2-4], suppression of viral load to <50 copies/mL (as opposed to 50-500 [or 400] copies/mL) [8-10], shorter time from achieving a viral load <50 copies/mL [1, 5, 9-11], and self-reported medication nonadherence and plasma drug concentrations below the optimal level [12, 13]. A change in adherence behavior over time after the date of achievement of viral suppression is also likely to play a major role [14, 15]. It has been shown, both in randomized trials [5, 7, 15-23] and in observational studies [2-4, 24-31], that the rates of viral rebound may also differ according to the specific regimen used.
Comparison between rates of viral rebound in patients receiving abacavir has been the focus of several recent analyses [21-23, 30-32]. A post hoc, nonrandomized comparison of the time to viral rebound in a subset of patients in the A5095 trial who had achieved suppression of viral load to <50 copies/mL showed only a trend in favor of efavirenz [21]. Another trial showed that patients with viral suppression who were switched from a protease inhibitor (PI)-based regimen to abacavir had a higher risk of viral rebound than did those who were switched to efavirenz, when the analysis was restricted to patients who were antiretroviral naive at the time of randomization [22]. A meta-analysis of the randomized trials confirmed that switching the PI to abacavir increases the risk of viral rebound, compared with switching to a nonnucleoside reverse-transcriptase inhibitor, but that this increased risk seems to be restricted to patients with pre-cART nucleoside experience [32]. In addition, 2 analyses of observational studies were performed recently, the first showing a difference in the rate of viral rebound that favored efavirenz over abacavir, both in antiretroviral-naive patients and in antiretroviral-experienced patients [30], and the second showing little difference, possibly because of the small number of events/person-years available for analysis [31].
Most importantly, no randomized comparison of the rate of viral rebound according to the use of abacavir or efavirenz has been performed in patients who were antiretroviral naive at the initiation of therapy, who have achieved suppression of viral load to 50 copies/mL, and who were subsequently switched to abacavir or efavirenz. The low rate of viral rebound in these study populations makes such a trial unlikely to be performed. We planned a number of analyses to address whether there might be a difference in viral rebound rate and in the occurrence of lipid abnormalities between patients currently receiving abacavir and those receiving efavirenz.
ABSTRACT
Background. Our objective was to compare the rate of viral rebound and therapy failure in patients receiving abacavir or efavirenz as the third drug (in addition to 2 non-abacavir nucleosides) in combination antiretroviral therapy (cART) and to compare the rate of metabolic alteration associated with these regimens.
Methods. We conducted a multicohort prospective observational study of human immunodeficiency virus-infected patients who had attained viral loads <80 copies/mL while receiving cART, without having previously received antiretrovirals. The rates of virological rebound, therapy failure, and lipid-level alteration during follow-up were calculated as the number of events divided by person-years of follow-up (PYFU). A multivariable analysis was performed using a Poisson regression model.
Results.
We studied a total of 744 patients; the median age was 37 years, 27% of the patients were female, and 41% were heterosexual. There was a total of 854 PYFU spent receiving efavirenz and 285 spent receiving abacavir. The nucleoside reverse-transcriptase inhibitor pairs most frequently used were zidovudine/lamivudine (66% of PYFU), stavudine/lamivudine (17.6%), and stavudine/didanosine (5.4%).
The adjusted relative rates of virological failure and therapy failure for abacavir, compared with those for efavirenz, were 2.17 (95% confidence interval [CI], 1.12-4.18; P = .02) and 1.41 (95% CI, 1.01-2.01; P = .05), respectively.
Conclusions. Patients with virological suppression while receiving regimens containing abacavir appear more likely to experience virological and therapy failure than those receiving efavirenz as their third drug. Although this is a selected group of adherent patients, bias cannot be ruled out, because this is a nonrandomized comparison.
DISCUSSION
The first important result of this analysis was the confirmation, in patients who were antiretroviral naive at the initiation of cART and belonged to a distinct clinical setting, that, overall, the rate of viral rebound after the achievement of viral suppression is very low. Our estimate of the rate of viral rebound (4.8% per year) was very similar to those estimated in other observational studies (6.3 per 100 PYFU in the UK Collaborative HIV Cohort [CHIC] analysis [30] and 4.9 per 100 PYFU in the EuroSIDA analysis [31]).
The main focus of our analysis was to compare the rate of virological failure and therapy failure according to the use of efavirenz and abacavir. In an analysis adjusted for a large number of measured confounding factors (including frequency of viral load monitoring and calendar period), we found a 2-fold increased risk of viral rebound in patients receiving abacavir-containing cART regimens, compared with that in patients receiving efavirenz-containing regimens. This result is consistent with those obtained in a nonrandomized comparison performed within the ACTG 5095 trial and in the CHIC analysis [21, 30]. However, a previous analysis suggested that there was no difference in the rate of rebound between these 2 drugs, although the 95% CIs were wide and, in fact, overlapped with our estimated RR of 2.17 [31].
The magnitude of the difference and strength of the association in our study remained the same irrespective of the duration of viral suppression before rebound or the specific NRTI pair used. Therefore, our results seem to argue in favor of switching patients who are receiving abacavir and have a viral load that is currently suppressed to below a quantifiable level to a more virologically potent therapy. When such a decision is being made, however, treatment toxicity issues should be taken into consideration, and the decision should be tailored to individual patients. In fact, multiple possible strategies, such as a switch to efavirenz or intensification with tenofovir/efavirenz, were planned to be evaluated in patients receiving abacavir-containing cART regimens whose follow-up was extended in the ACTG A5095 trial [37].
Here, we have also shown that the rate of failure of abacavir-containing cART regimens was higher than that of efavirenz-containing cART regimens. Indeed, in a separate analysis, even the probability of discontinuing abacavir therapy was higher than that of discontinuing efavirenz therapy (RR, 1.46 [95% CI, 1.00-2.12]; P = .05), as a result of more people discontinuing abacavir than efavirenz because of therapy failure.
Interestingly, the risk of an increase in total cholesterol level tended to be lower in patients currently receiving abacavir than in those receiving efavirenz. This was, however, paralleled by some evidence (albeit inconclusive) that the risk of an increase in LDL cholesterol level was higher in patients receiving abacavir. For treatment decisions, the risk of virological failure needs to be balanced with the risk of long-term hyperlipidemia; the role of abacavir in treating HIV-infected patients who are at high risk for cardiovascular events needs to be further evaluated [38]. Also, the analysis of the reasons for discontinuing the third drug confirmed that abacavir-containing regimens are less likely to be discontinued because of intolerance than are regimens containing efavirenz.
Another important aspect of this study is the comparison between NRTI pairs. Both the time to virological failure and the time to therapy failure indicated that the use of stavudine/didanosine was associated with a lower probability of sustained success than was the use of zidovudine/lamivudine. This finding is consistent with the results of the ACTG 384 trial [39], which also showed that, when used in combination with efavirenz, stavudine/didanosine leads to a higher rate of NRTI resistance than does zidovudine/lamivudine [40]. However, there may be an interaction with the third drug used [31, 41, 42]; for example, no difference was observed in patients using nelfinavir-containing regimens [40]. Further, the fact that stavudine has recently been identified as one of the determinants of long-term peripheral fat loss may have determined the higher rate of switching from this NRTI pair [42, 43]. In general, our data showing the inferiority of stavudine/didanosine to zidovudine/lamivudine are in agreement with the results of other recent nonrandomized comparisons [30, 31]. Again, the EuroSIDA study identified a signal for a potential difference in the rate of rebound during stavudine/didanosine therapy as compared with zidovudine/lamivudine therapy, and, in the larger UK CHIC study, the results reached statistical significance.
The debate as to when-or whether-statistical analysis of observational data in which allocation to treatment groups has not been determined at random should be performed to compare specific drugs is ongoing [44-46]. The main criticism of such analyses is that both standard multivariable analyses as well as other approaches fail to control for confounding by indication [47]. In our analysis, it is conceivable that abacavir was given to those who, more than others, needed a regimen that was particularly easy to take, because of their lifestyle (injection drug users, people with HBV/HCV coinfection, etc.) [48]. Since these patients are also generally those who have more difficulty in maintaining the same level of adherence over time [49], this may partly explain the increased risk of rebound in the abacavir-containing therapy group. However, the complete breakdown of PYFU for injection drug users was 62 (24.2%) of 286 among those receiving abacavir and 204 (22.7%) of 843 among those receiving efavirenz, suggesting that there was no greater propensity to use one or the other drug in this group. Another unmeasured confounding factor might have been generated by the general unlikelihood of efavirenz being prescribed to patients who are perceived to be at higher risk of developing central nervous system toxicity [49]. However, for this analysis, we focused on a group of patients who were likely to have had sustained adequate drug levels before baseline, as documented by the achievement of a viral load 8<0 copies/mL at entry. Therefore, we think that it is reasonable to assume that the impact of unmeasured confounding factors is negligible in this setting. However, it has been documented that <100% of patients generally report being fully adherent when a questionnaire is filled out at a time when viral load was suppressed [50].
In conclusion, the present study appears to provide further evidence that abacavir is inferior to efavirenz when the objective is to maintain virological or therapy success. Our data also seem to be consistent with the view that stavudine/didanosine is virologically less potent than zidovudine/lamivudine, at least in the context of PI-sparing regimens. We believe that our findings are very important for those who, like ourselves, are interested in identifying which currently available strategies are the best for treating patients infected with HIV. However, the limitations of this nonrandomized comparison should be fully understood.
PATIENTS AND METHODS
Cohorts and patient selection. In this analysis, we included patients enrolled in the Italian Cohort of Patients Naive from Antiretrovirals (ICoNA), as well as those seen at the Infectious Disease Wards of Catholic University of Sacro Cuore (UCSC), Rome, and the Institute of Infectious Diseases, University of Milan (IMIT), Milan. In all of these studies, the dates of initiation and discontinuation of each antiretroviral regimen and the viral load and CD4 cell count at each clinical visit (every 4-6 months, on average) were recorded. Viral loads were measured using the Roche PCR Amplicor version 1.5 (limit of detection, 50 copies/mL), Bayer Diagnostics Versant bDNA 3.0 (limit of detection, 50 copies/mL), or BioMerieux Organon-Teknika Nuclisens QT (limit of detection, 80 copies/mL), depending on the study center. More details of these studies are provided elsewhere [33-35]. Criteria for inclusion were the following: patients had to have started cART when they were still antiretroviral naive, and they needed to have attained a viral load <80 copies/mL on at least 1 occasion without having previously experienced virological failure while receiving cART.
Statistical analysis. Time 0 of the analysis was defined as the time at which the study participants first achieved a viral load 80 copies/mL while receiving cART. We have considered a threshold of 80 copies/mL instead of 50 copies/mL, to include an additional 13% of patients in whom viral load was measured using an assay with a lower limit of detection of 80 copies/mL. Two main analyses have been performed. A time to virological failure (i.e., viral rebound) analysis, in which the time of the event was defined as the date of the first of 2 consecutive viral load measurements >400 copies/mL. A second analysis was conducted to evaluate the time to therapy failure, in which the time of the event was defined as the time of virological failure or discontinuation of abacavir or efavirenz therapy, irrespective of the reason for discontinuation. The number of events, PYFU (from the date of viral suppression to the date of the event or the last available viral load measurement), and rates were calculated according to the use of abacavir or efavirenz as the "third drug." All defined viral rebounds were genuine rebounds during receipt of therapy and not "failures to resuppress" after a treatment interruption. Data were organized into distinct monthly intervals, and viral rebound was attributed to abacavir (or efavirenz) if a patient was receiving abacavir (or efavirenz) during the month immediately before the date of viral rebound, regardless of the drug received during the month of rebound itself. This was done to avoid the allocation of a rebound to the drug that a patient had been switched to as a consequence of having experienced viral rebound.
A number of potential confounding factors have also been considered, including clinical center (64 centers in ICoNA, plus UCSC and IMIT), sex, age, mode of HIV transmission, and CD4 cell count (raw scale, per 100 cells/uL) and viral load (log10 scale) at cART initiation (time-fixed covariates); and NRTI pair received at the time of rebound and whether the patients had been switched to abacavir or efavirenz since achieving a viral load <80 copies/mL (time-dependent covariates). For the main analysis of virological and therapy failure, coinfection with hepatitis B virus (HBV) and hepatitis C virus (HCV) and frequency of viral load measurements (time-fixed covariates) and calendar period (time-dependent covariate) were additionally included. A multivariable Poisson regression analysis with both time-fixed and time-dependent covariates was performed.
In addition, the rate of occurrence of lipid (i.e., total cholesterol, low-density lipoprotein [LDL] cholesterol, and triglycerides) level increases was also compared using Poisson regression. For consistency, to show what happened to patients' lipid levels during the same period in which the risk of failure had been assessed, we used the first time at which viral load was <80 copies/mL as time 0 for this analysis. Patients were defined as having experienced an event at the time at which their laboratory markers went up by >1 category in the National Cholesterol Education Program (NCEP) (Adult Treatment Panel III) scale (e.g., from desirable to above desirable, from borderline high to above borderline high, etc. [36]). Patients whose lipid levels were already high at time 0 were defined as having developed an event when they experienced an increase of 1 upper limit of normal above the baseline value. Follow-up was censored at the date of the last available clinical visit. In this analysis, we also included the baseline value of the specific marker under evaluation in the multivariable analysis.
RESULTS
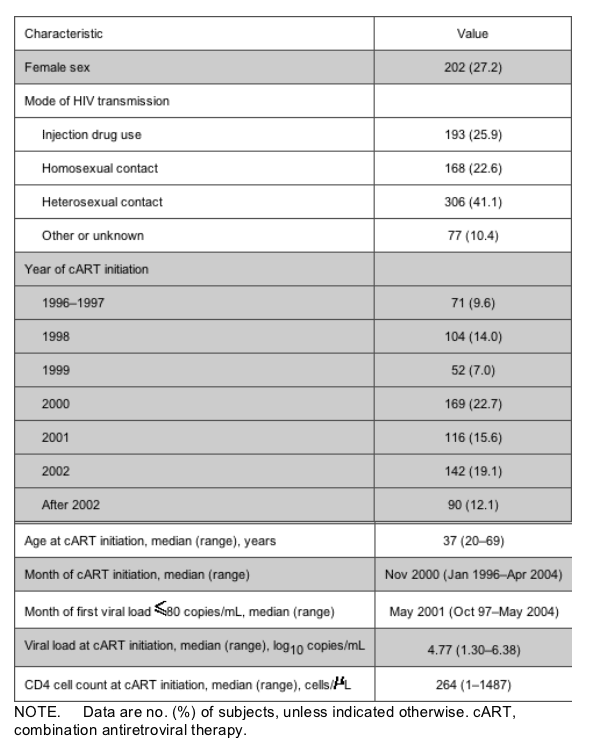
Study population. Our analysis focused on a total of 744 patients (74.5% [n = 554] enrolled in ICoNA, 13.0% [n = 97] seen at UCSC, and 12.5% [n = 93] seen at IMIT). Overall, these patients have been followed up for 1140 PYFU, from the time of first achieving a viral load 80 copies/mL to viral rebound or last viral load measurement. The maximum calendar time span of the study was October 1997-November 2004. The characteristics of the 744 patients are shown in table 1.
Table 1. Characteristics of the study population (n = 744).
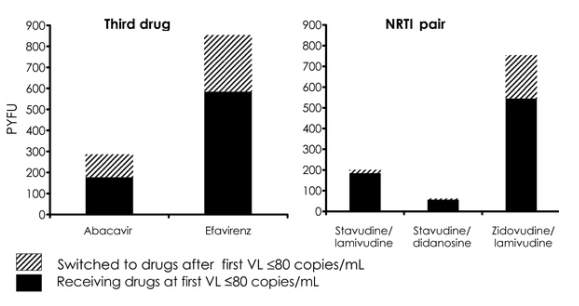
Antiretroviral drug exposure. Figure 1 shows the total number of PYFU spent receiving abacavir, efavirenz, and each of the most frequently used NRTI pairs, from the date of first suppression to the date of viral rebound or last viral load measurement. Overall, patients spent 286 PYFU receiving abacavir, 854 receiving efavirenz, 200 receiving stavudine/lamivudine, 61 receiving stavudine/didanosine, 754 receiving zidovudine/lamivudine, and 124 receiving other NRTI pairs. In the bar chart, these PYFU have been divided into (1) those that were spent receiving abacavir, efavirenz, or an NRTI pair in patients who were receiving them at the time of the first viral load <80 copies/mL and (2) those that were spent in patients who started receiving these drugs after the achievement of a viral load <80 copies/mL. There was a tendency for abacavir to be switched more often than efavirenz after the achievement of viral suppression (38.3% vs. 31.6% of the PYFU in the group). With regard to the NRTI pairs, if there had been a switch after the achievement of viral load suppression, it was more likely to be to zidovudine/lamivudine (27.8% of PYFU) than to stavudine/lamivudine (7.4% of PYFU) or stavudine/didanosine (7.3% of PYFU).
Figure 1. Total no. of person-years of follow-up (PYFU) receiving abacavir/efavirenz and specific nucleoside reverse-transcriptase inhibitor (NRTI) pairs, according to whether patients were receiving these drugs at the time of first viral load (VL) <80 copies/mL or had been switched to them at a later time point.
Viral rebound. The total number of rebounds in viral load to >400 copies/mL, the PYFU, the crude rates of rebound, and the 95% confidence intervals (CIs) for these rates are shown in tables 2 and 3. The overall rebound rate was 4.8 per 100 PYFU (55 rebounds in 1140 PYFU [95% CI, 3.6-6.3 per 100 PYFU]). The rate was 85% higher in patients currently receiving abacavir than in those receiving efavirenz. Among the NRTI pairs, the use of stavudine/lamivudine and zidovudine/lamivudine was associated with a risk of virological failure lower than that associated with stavudine/didanosine.
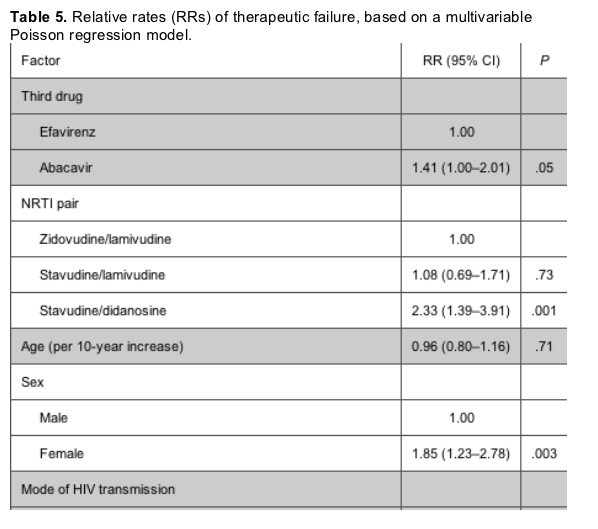
Table 2. Crude rate of virological failure, according to whether the regimen contained abacavir or efavirenz and according to most frequently used nucleoside reverse-transcriptase inhibitor (NRTI) pair.
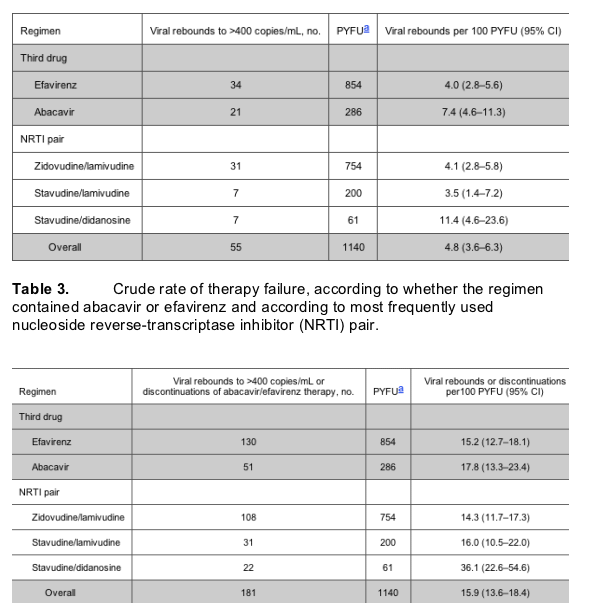
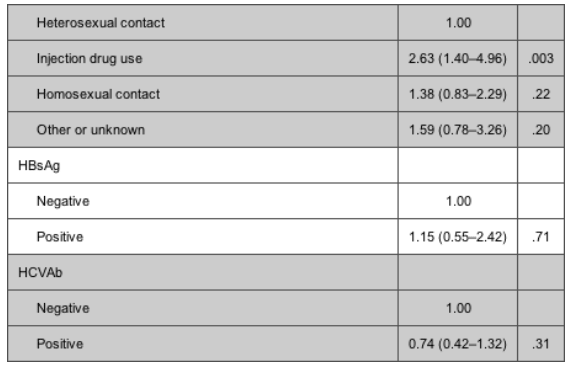
Table 4 shows the adjusted (for all the confounding factors mentioned in Statistical Analysis) relative rates of viral rebound, comparing abacavir with efavirenz and the 3 NRTI pairs. The rate of rebound in viral load to >400 copies/mL was significantly higher in patients currently receiving abacavir as a third drug than in those currently receiving efavirenz (relative rate [RR], 2.17 [95% CI, 1.12-4.18]; P = .02) (table 4). Further, there was a significantly increased rate of viral rebound in patients receiving stavudine/didanosine, compared with that in patients receiving zidovudine/lamivudine (RR, 2.64 [95% CI, 1.04-6.72]; P = .04). Before testing specific pairwise comparisons of NRTI pairs, we performed a global test for heterogeneity, the results of which also suggested the existence of a significant association (X2 = 7.54; P = .02). The only other factor independently associated with the risk of viral rebound was the mode of HIV transmission; injection drug users were at increased risk, compared with patients infected through heterosexual contact (RR, 3.23 [95% CI, 1.08-9.62]; P = .04).
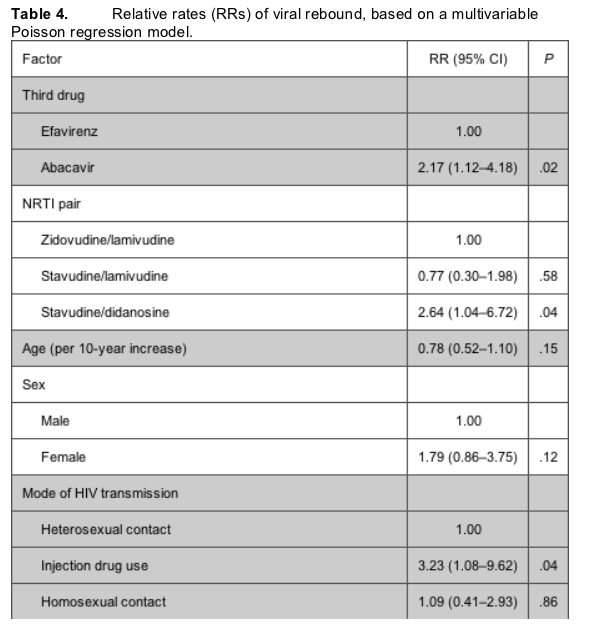
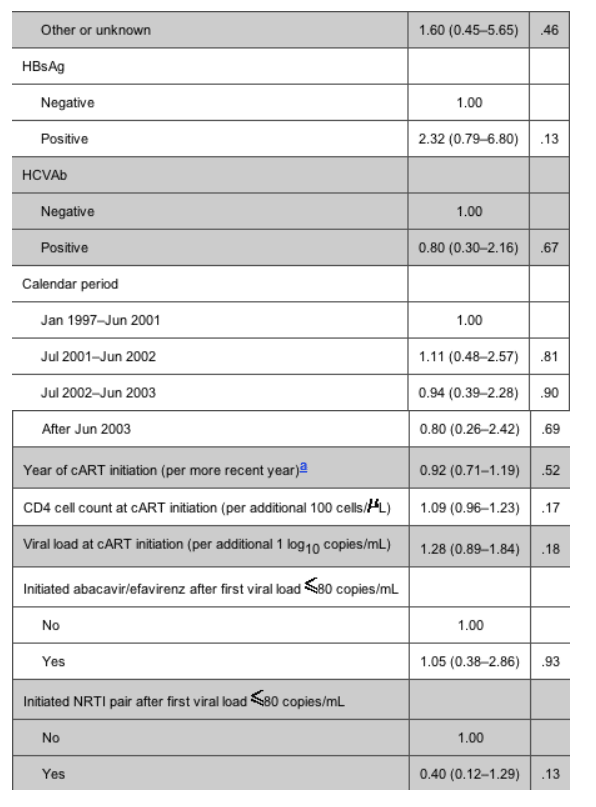
We also evaluated whether there was evidence that the difference in the RR of viral rebound between abacavir and efavirenz varied between patients who achieved a viral load <80 copies/mL while receiving an abacavir-containing cART regimen (group 1) and those who were switched to abacavir after the achievement of viral suppression (group 2). There was no evidence to support the presence of this interaction (P = .74), and the effects were, indeed, similar in the 2 groups (group 1: RR, 1.78 [95% CI, 0.93-3.41]; group 2: RR, 2.16 [95% CI, 0.78-5.95]).
Furthermore, we repeated the analysis separately in patients for whom viral load was documented to be <80 copies/mL for <1 year (RR, 2.54 [95% CI, 1.12-5.75]) and for those whose viral loads were suppressed for >1 year (RR, 1.93 [95% CI, 0.76-4.94]). There was no evidence of a difference between these 2 estimates (Pinteraction = .66), which confirmed an about 2-fold higher risk of viral rebound for patients receiving abacavir- versus efavirenz-containing regimens, regardless of prior duration of viral suppression. In addition, we found no evidence (Pinteraction = .64) that the RR of rebound while receiving abacavir and that while receiving efavirenz differed according to whether zidovudine/lamivudine (RR, 2.77 [95% CI, 1.28-6.00]) or stavudine/lamivudine (RR, 5.46 [95% CI, 0.38-78.03]) was the NRTI pair used.
Viral rebound and discontinuation. When we compared the time to therapy failure, we found similar results. As expected, the overall event rate was higher because, in this analysis, the discontinuations also counted as failures (15.9 per 100 PYFU [95% CI, 13.6-18.4]) (table 3). Of 128 discontinuation events, 97 (75.8%) occurred in patients currently receiving efavirenz. For a significantly higher proportion of patients receiving abacavir, compared with patients receiving efavirenz, the reason for discontinuation was therapy failure (12.9% vs. 3.4%; P = .03) rather than intolerance (25.8% vs. 37.1%), whereas there was no difference in relation to other reasons: laboratory toxicity (10.1% vs. 9.7%) and patients' choice (49.4% vs. 51.6%).
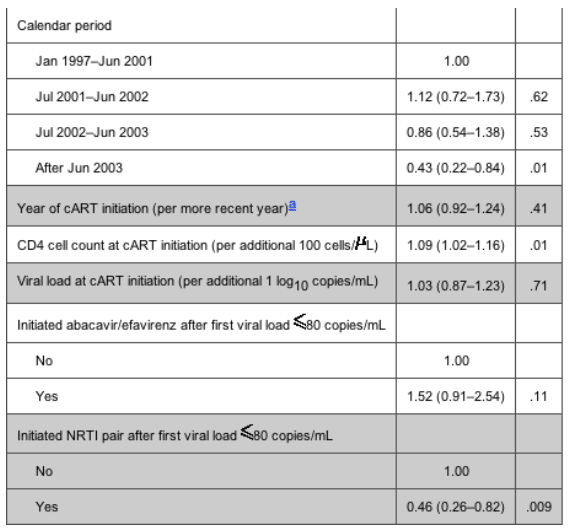
The rate of therapy failure in patients receiving abacavir was, again, higher than that in patients receiving efavirenz; however, the difference was less striking than that in the virological failure analysis (17.8 vs. 15.2 per 100 PYFU) (table 3). Among the NRTI pairs studied, patients receiving stavudine/didanosine were, again, those with the highest rate of therapy failure. Table 5 shows the relative rates of therapy failure according to whether the regimen contained abacavir or efavirenz (with efavirenz chosen as the reference group) and according to NRTI pair (with zidovudine/lamivudine again chosen as the reference group). Significantly higher therapy failure rates were observed in patients receiving abacavir than in those receiving efavirenz (RR, 1.41 [95% CI, 1.00-2.01]; P = .05) and in those receiving stavudine/didanosine than in those receiving zidovudine/lamivudine (RR, 2.33 [95% CI, 1.39-3.91]; P = .001). Again, there was no evidence that the results might have been different if we separately examined patients who achieved viral suppression while receiving abacavir/efavirenz or who started receiving these drugs at some point after time 0 (Pinteraction = .65). Injection drug users were at an increased risk of therapy failure, compared with patients who acquired HIV through heterosexual contact (RR, 2.63 [95% CI, 1.40-4.96]; P = .003). In addition, CD4 cell count at cART initiation (RR, 1.09 per additional 100 cells/uL [95% CI, 1.01-1.56 per additional 100 cells/uL]; P = .02) and female sex (RR vs. male sex, 1.85 [95% CI, 1.23-2.78]; P = .003) were associated with a higher risk of discontinuation or virological failure. In contrast, a lower risk of therapy failure was observed after June 2003 (compared with the period January 1997-June 2001; RR, 0.43 [95% CI, 0.22-0.84]; P = .01) and in patients who initiated the current NRTI pair after time 0 (compared with those who achieved a viral load <80 copies/mL while receiving the current NRTI pair; RR, 0.46 [95% CI, 0.26-0.82]; P = .009).
Results were similar when all analyses shown in all of subsections above were repeated with the subpopulation of patients for whom suppression of viral load to <50 copies/mL was documented (data not shown).
Lipid level increase. The collection of data on lipid levels at time 0 was fairly complete (74.4% of patients had a measurement of cholesterol, 31.6% had a measurement of LDL, and 77.2% had a measurement of triglycerides). Overall, according to our definition based on NCEP categories [36], over a follow-up of 973 PYFU, 212 patients experienced a total cholesterol level increase (21.8 per 100 PYFU [95% CI, 19.0-24.9]), 100 experienced an LDL cholesterol level increase (8.2 per 100 PYFU [95% CI, 6.7-10.0]), and 213 experienced a triglyceride level increase (22.4 per 100 PYFU [95% CI, 19.5-25.6]). After adjusting for all confounding factors, including baseline lipid levels, we estimated an RR (abacavir vs. efavirenz) of 0.73 (95% CI, 0.50-1.05; P = .09) for total cholesterol, 1.78 (95% CI, 0.99-3.21; P = .06) for LDL cholesterol, and 1.13 (95% CI, 0.79-1.63; P = .50) for triglyceride level increase. These data suggest that there is a lower risk of a total cholesterol level increase-but a higher risk of an LDL cholesterol level increase-in patients currently receiving abacavir than in those receiving efavirenz. No difference in the risk of triglyceride level increase was observed. There was no evidence that the rate of lipid level increases was associated with a particular NRTI pair (data not shown).
|
|
| |
| |
|
|
|