| |
Safety and efficacy of darunavir in combination with low-dose ritonavir: 48-week results from the POWER studies
|
| |
| |
"...Both baseline FC to DRV < /=10 and presence of < /=2 DRV-associated mutations appear to be strong predictors of virologic response..."
Reported by Jules Levin
Presented at HIV-DART, Frontiers in Drug Development for Antiretroviral Therapies, 10-14 December 2006, Cancun, Mexico
P Ruane1; JE Gallant2; A Tennenberg3; and SS Guzman4
1Light Source Medical, Los Angeles, CA, USA; 2Johns Hopkins University School of Medicine, Baltimore, MD, USA; 3Tibotec Therapeutics, Bridgewater, NJ, USA; and 4Tibotec BVBA, Mechelen, Belgium
AUTHOR CONCLUSIONS
DRV/r 600/100mg bid demonstrated significant virologic and immunologic efficacy in treatment-experienced patients at Week 48
- 45% of patients in POWER 1, 2, and 3 achieved VL <50 copies/mL.
The efficacy of DRV/r was durable, with the majority of patients who achieved VL <50 copies/mL at Week 24 remaining undetectable at Week 48.
Pretreatment susceptibility to DRV, as defined by FC in EC50 to DRV and/or number of DRV-associated mutations, was predictive of treatment response.
Longer-term safety data did not reveal any new safety findings and appear to confirm that DRV/r 600/100mg bid is generally well tolerated.
ABSTRACT
Background: POWER 1, 2, and 3 evaluated efficacy and safety of darunavir (DRV; TMC114 [PREZISTA]) co-administered with low-dose ritonavir (DRV/r) in treatment-experienced patients with HIV. Results from a 48-week analysis of DRV/r 600/100mg bid are presented.
Methods: POWER 1 and 2 were randomized, controlled, partially blinded, multi center, Phase IIb trials comparing different DRV/r doses with investigator selected control protease inhibitors (CPIs). A combined Week 48 analysis of patients receiving DRV/r 600/100mg bid (n=131) and CPI(s) (n=124) in POWER 1 and 2 was conducted. POWER 3 consists of two open-label, non-randomized studies; 324 patients received de novo DRV/r 600/100mg bid and are included in this integrated 48-week analysis. Patients received DRV/r (or CPIs in POWER 1 and 2) plus optimized background regimen of 2 or more NRTIs±enfuvirtide. Response was measured by percentages of patients achieving 31 log10 reduction in viral load (VL) and those reaching undetectable VL (<50 copies/mL) at Week 48.
Results:
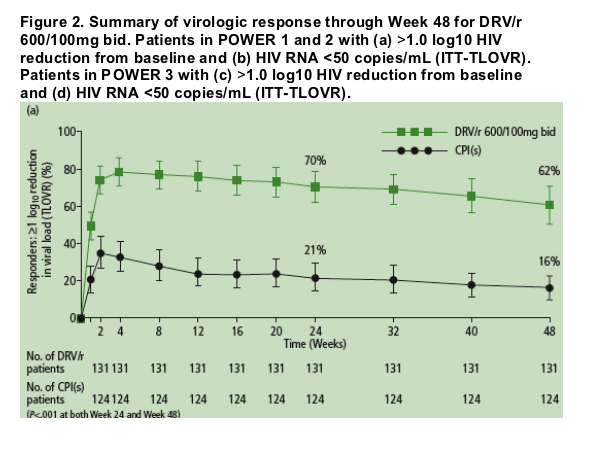
At Week 48 in the pooled POWER 1 and 2 analysis, 62% and 16% of patients receiving DRV/r vs CPI(s), respectively, achieved >1 log10 reduction in VL from baseline (P<.001); 45% and 11%, respectively, achieved undetectable VL (P<.001).
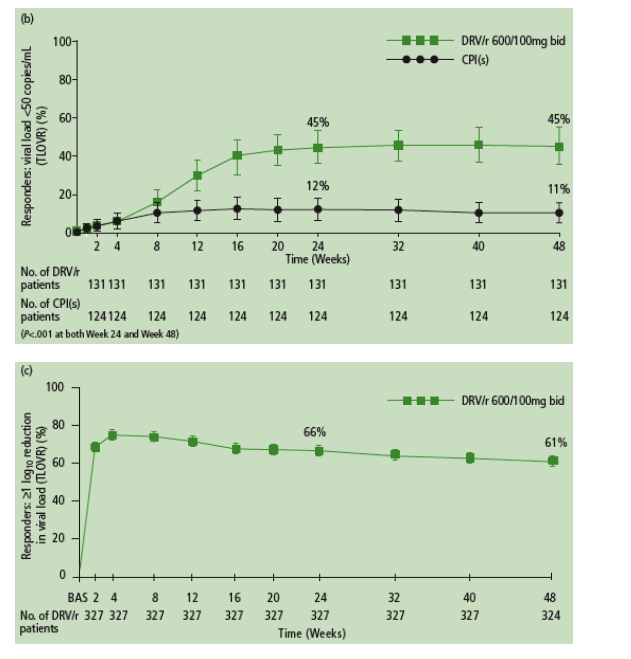
POWER 3 results were comparable; 61% of patients achieved >1 log10 reduction in VL at Week 48 and 45% reached undetectable VL.
Over 90% of patients in POWER 1, 2, and 3 who reached undetectable VL at Week 24 sustained this response through Week 48.
Most patients (73% in POWER 1 and 2; 82% in POWER 3) who achieved >1 log10 reduction in HIV RNA at Week 24, but not undetectable VL, maintained or improved their virologic response through Week 48.
Baseline phenotypic fold change (FC) to DRV and number of DRV-associated mutations were strong predictors of response: 54%, 28%, and 14%, respectively, of patients with FC 210, FC >10-40 and FC >40 reached undetectable VL; as did 59%, 46%, and 20% of patients with < /=1, 2, and >/=3 DRV-associated mutations.
The most commonly reported adverse events (>/=10%) in patients receiving DRV/r 600/100mg bid were mild-to-moderate diarrhea, nausea, nasopharyngitis and headache.
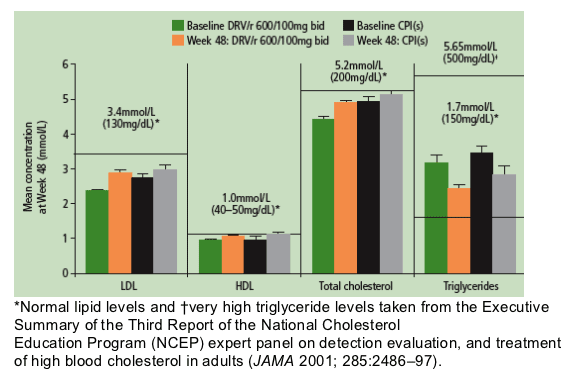
In the pooled POWER 1 and 2 analysis, mean low-density lipoproteins, high-density lipoproteins, and total cholesterol levels remained within normal ranges per the National Cholesterol Education Project guidelines. Triglyceride levels were above normal for all patients at baseline; at Week 48, mean triglyceride levels for DRV/r and CPI patients decreased by 24% and 25%, respectively.
Conclusion: In the POWER studies, 45% of treatment-experienced HIV patients receiving DRV/r 600/100mg bid achieved undetectable VL (<50 copies/mL) at Weeks 24 and 48. Longer-term safety data confirmed earlier results showing DRV/r 600/100mg bid to be generally safe. Both baseline FC to DRV < /=10 and presence of < /=2 DRV-associated mutations appear to be strong predictors of virologic response.
Introduction
Plasma viremia is a strong indicator of HIV disease progression, and reducing plasma HIV RNA levels with antiretroviral therapy provides considerable clinical benefit.1, 2
DRV is currently approved in the US, Canada, Russia, and Argentina with low-dose ritonavir (DRV/r) at a recommended dose of 600/100mg bid for the treatment of HIV infection in antiretroviral treatment-experienced adult patients.
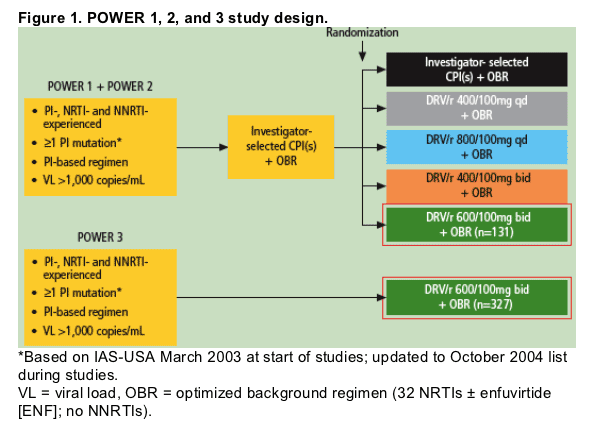
POWER 1 and 2 (TMC114-C213 and TMC114-C202) were Phase IIb, randomized, controlled trials designed to investigate the efficacy and safety of darunavir (DRV; TMC114 [PREZISTA]) co-administered with low-dose ritonavir (DRV/r) compared with investigator-selected control PIs (CPI[s]) in treatment-experienced HIV patients.3-6
POWER 3 (TMC114-C215 and TMC114-C208)7 was an open-label, single-arm analysis to gather additional safety and efficacy data at the recommended dose of 600/100mg bid.
We present here 48-week combined safety and efficacy results from POWER 1 and 2, and 48-week results from POWER 3.
Methods
Patients and study design
The rationale for pooling the data from the POWER 1 and 2 trials was similarities in patient baseline disease characteristics, DRV/r dosing, site selection, inclusion/exclusion criteria, and efficacy and safety outcomes (Figure 1).
Primary inclusion criteria for patients were as follows:
- HIV RNA >1,000 copies/mL.
- 33 months prior treatment with 32 NRTIs and 31 NNRTI in a failing regimen.
- 31 PI treatment received for at least 3 months.
- 31 primary PI resistance-associated mutation (based on the 2003 IAS-USA
guidelines8 and updated in 20049 to include D30N, L33F/I, M46I/L, G48V, I50L/V, V82A/F/L/S/T, I84A/C/V, and L90M).
All patients receiving DRV/r 600/100mg bid in the three POWER trials were included in this analysis (N=458).
Investigators selected an optimized background regimen (OBR) consisting of >/=2 NRTIs with or without enfuvirtide (ENF) based on genotypic resistance testing (VirtualPhenotype, Virco BVBA) and prior antiretroviral (ARV) history. The use of any other PI or NNRTIs with DRV/r was not permitted.
The primary endpoint was confirmed response (intent-to-treat using time-to-loss of virologic response [ITT-TLOVR]) of >1.0 log10 HIV RNA reduction from baseline at Week 24.
Clinical and laboratory adverse events (AEs) were graded according to a modified ACTG severity scale and relation to study medication (as evaluated by trial investigators).
Safety data shown for POWER 1, 2, and 3 are based on a pre-planned analysis of all available data, completed in September 2005, and performed for the original NDA submission. An updated efficacy analysis of POWER 1, 2, and 3 was performed in May 2006 and is presented here.
Analyses presented here are in patients receiving DRV/r 600/100mg bid.
Results
Baseline characteristics
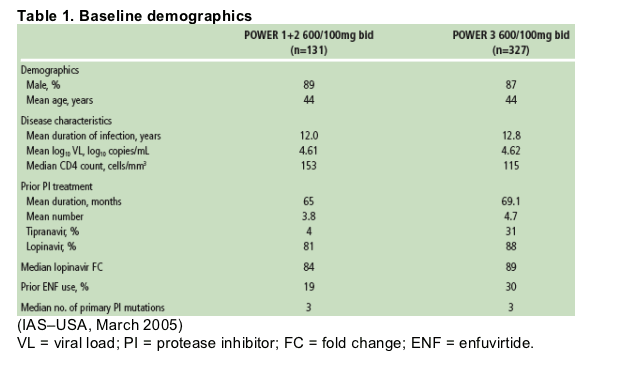
Of 458 patients receiving DRV/r 600/100mg bid in the POWER trials (Table 1), 455 had completed through Week 48 or discontinued earlier at the time of analysis.
70% of patients had baseline fold change in EC50 (FC) to DRV < /=10, 17% had FC >10-40, and 13% had FC >40.
Overall efficacy
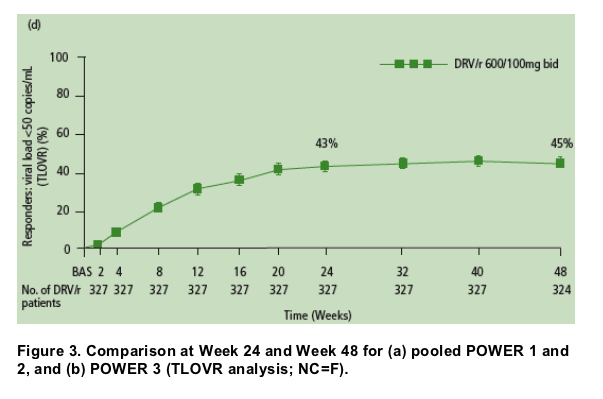
Virologic efficacy is summarized in Figure 2.
Virologic responses to DRV/r were durable through Week 48.
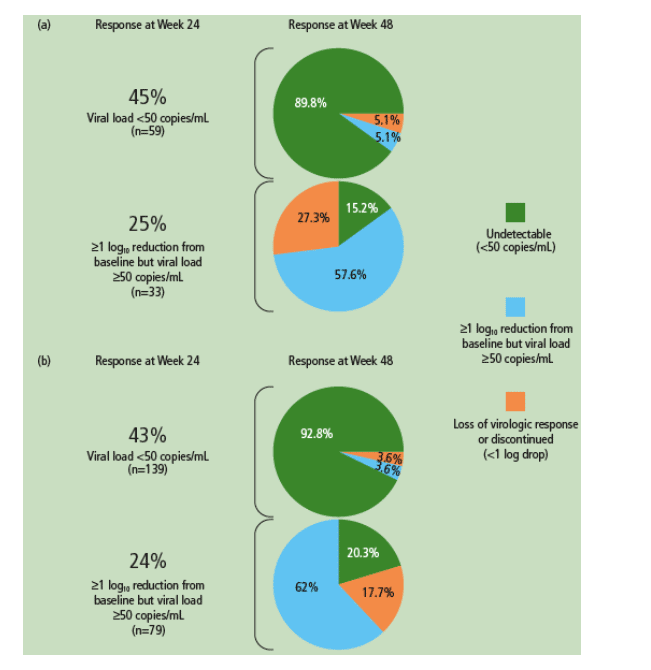
- Nearly all of the patients (90% in POWER 1 and 2, and 93% in POWER 3) who achieved HIV RNA <50 copies/mL at Week 24 remained undetectable at Week 48 (Figure 3a).
- The majority of patients (73% in POWER 1 and 2, and 82% in POWER 3) who achieved >1 log10 reduction in HIV RNA at Week 24 but did not achieve full virologic suppression to <50 copies/mL maintained or improved this response at Week 48 (Figure 3b).
Mean increase in CD4 count at Week 48 was 102 cells/mm3 in POWER 1 and 2 combined, and 107 cells/mm3 in POWER 3.
Factors influencing response to DRV/r in POWER 1, 2, and 3 (n=455)
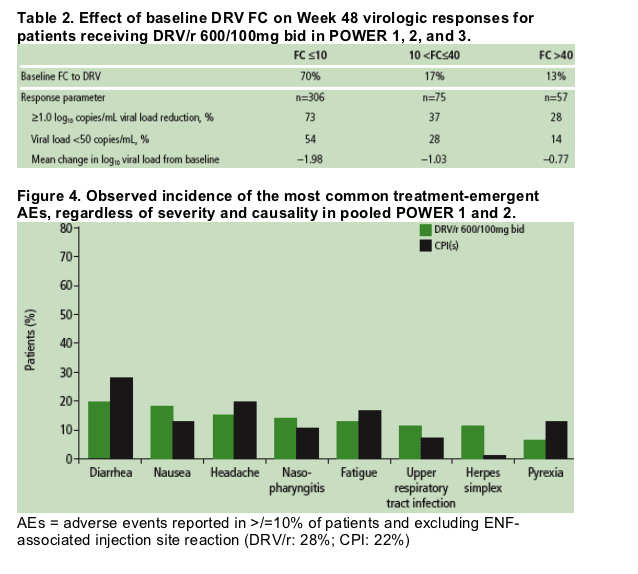
For all virologic efficacy parameters, responses were improved in the subgroup of patients with DRV FC < /=10 (Table 2).
Number of DRV-associated mutations (V11I, V32I, L33F, I47V, I50V, I54L or M, G73S, L76V, I84V, or L89V)10 at baseline was also a strong predictor of response. Patients whose virus had < /=2 DRV-associated mutations also had a median of 7-8 PI resistance-associated mutations.
Safety
DRV/r was generally safe and well tolerated; the majority of AEs were mild to moderate (Grade 1 or 2) in severity.
Discontinuations due to AEs were infrequent: 9% for DRV/r and 5% for CPI(s) in POWER 1 and 2 combined, and 2% in POWER 3.
The most common treatment-emergent AEs in at least 10% of patients in POWER 1 and 2, regardless of severity or relationship to study drug, are shown in Figure 4. The most common treatment-emergent AEs in at least 10% of patients in POWER 3 were diarrhea (14%), nasopharyngitis (11%), and nausea (10%). No dose relationship with DRV/r was observed and there was no clear relationship between DRV/r dose and the frequency or severity of AEs. Notably, diarrhea was higher in the CPI group.
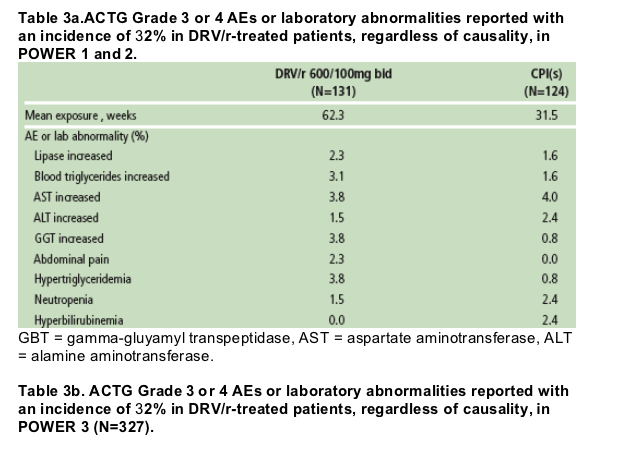
The profile of Grade 3/4 AEs was similar in the DRV/r and CPI group in POWER 1 and 2 (Table 3a). Grade 3 or 4 AEs reported in POWER 3 are shown in Table 3b.
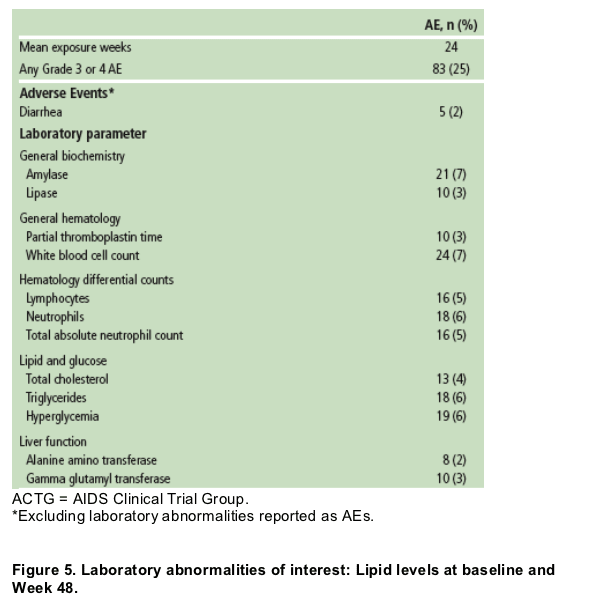
None of the 5 deaths in POWER 1 and 2 or the 6 deaths in POWER 3 was attributed to DRV/r.
In POWER 1 and 2, lipid levels at Week 48 were similar between patients treated with DRV/r and control PIs. Mean triglyceride levels decreased from baseline in both treatment groups at Week 48 (Figure 5).
References
1. Mellors JW, et al. Science 1996;272:1167-70.
2. O'Brien WA, et al. N Engl J Med 1996;334:426-31.
3. Katlama C, et al. 3rd IAS Conference on HIV Pathogenesis and Treatment, Rio de Janeiro, Brazil, July 24-27, 2005. Abstract WeOaLB0.102.
4. Wilkin T, et al. 45th Interscience Conference on Antimicrobial Agents and Chemotherapy,Washington DC, USA, December 16-19, 2005. Abstract 2860.
5. Grinsztejn B, et al. 3rd IAS Conference on HIV Pathogenesis and Treatment, Rio de Janeiro, Brazil, July 24-27, 2005. Abstract WePeLB6.201.
6. Berger D, et al. 45th Interscience Conference on Antimicrobial Agents and Chemotherapy,Washington DC, USA, December 16-19, 2005. Abstract H-1094.
7. Molina JM, et al. 12th Annual Conference of the British HIV Association, Brighton, UK, March 29 - April 1, 2006. Abstract P4.
8. Johnson VA, et al. Top HIV Med 2003;11:215-21.
9. Johnson VA, et al. Top HIV Med 2004;12:119-24.
10. De Meyer S, et al. XV International HIV Drug Resistance Workshop June 13 17, 2006. Oral Presentation and Poster 73.
|
|
| |
| |
|
|
|