 |
 |
 |
| |
Changes in Lipid Parameters During Treatment with Lopinavir/ritonavir (LPV/r) Plus Zidovudine/lamivudine (ZDV/3TC) Induction Followed by Maintenance on LPV/r Monotherapy Compared to Efavirenz (EFV) + ZDV/3TC Through 96 Weeks
|
| |
| |
Reported by Jules Levin
International Workshop on Adverse Drug Reactions and Lipodystrophy in HIV, Sydney, Australia, July 19- 21, 2007
BA da Silva1, P Domingo2, V Joly3, A Rachlis4, M DeHaan1, K Wikstrom1, B Bernstein1, M King1, G Hanna1
1Abbott, Abbott Park, Illinois, USA; 2Hospital de la Santa Creu i Sant Pau, Barcelona, Spain; 3Bichat Claude Bernard
Hospital, Paris, France; 4Sunnybrook Health Sciences Centre, University of Toronto, Toronto, Ontario, Canada
AUTHOR SUMMARY
Both LPV/r and EFV-based antiretroviral therapy increased TC, LDL-C and HDL-C. These increases generally occurred early in therapy (by Week 24) and remained stable thereafter.
With increases in both LDL-C and HDL-C for both therapy groups, the LDL:HDL ratio did not change through Week 96 for either treatment group.
There was a trend toward a greater increase in TG levels for LPV/r compared to EFV-based therapy.
Apo B increased to a similar extent with both LPV/r and EFV-based therapy.
Lipid parameters were not impacted by discontinuation of the nucleoside reverse transcriptase inhibitors (ZDV/3TC) in the LPV/r group. This is in contrast to previously described lowering of TC and TG when stavudine was replaced by
tenofovir disoproxil fumarate in a regimen that also included LPV/r and lamivudine.8
No baseline parameters were associated with changes in lipid parameters, thus making it difficult to identify a priori which subjects would be affected by increases in lipid parameters.
The hs-CRP cutpoints for cardiovascular risk assessment have been described as: <1 mg/dL for low risk, 1- 3 mg/dL for medium risk, and >3 mg/dL for high risk. Few subjects had hs-CRP values >1 mg/dL and no subjects had hs-CRP values >3 mg/dL in either treatment group at baseline or Week 96.
AUTHOR CONCLUSIONS
Dynamics of TC, HDL-C, LDL-C, TG, Apo A1 and Apo B were comparable with a LPV/r-based inductionmaintenance strategy compared to EFV + ZDV/3TC. Consistent with a trend toward higher TG in the LPV/r group, larger increases in Apo C3 were observed in LPV/r-treated subjects.
Despite increases in TC and LDL, the LDL:HDL ratio was unchanged through 96 weeks for both regimens. hs-CRP remained low throughout the study.
Discontinuation of ZDV/3TC did not impact lipid changes in LPV/r-treated subjects.
BACKGROUND
The impact of long-term antiretroviral therapy on serum lipid measurements requires careful study. Whereas TC and LDL-C have a positive correlation with cardiovascular risk, HDL-C has a negative correlation. Based on this,
the LDL:HDL ratio is important in the assessment of cardiovascular risk.1
Highly sensitive C-reactive protein (hs-CRP) and apolipoprotein (Apo) A1, Apo B and Apo C3 are also important metabolic parameters which have not been routinely reported in HIV treatment trials.
--hs-CRP is an independent marker of cardiovascular risk even in individuals with LDL cholesterol values <130 mg/dL (3.4 mmol/L). 2,3,4
--Apo B may be a better predictor of cardiovascular events than non-HDL cholesterol and LDL cholesterol.5
--Apo A1 is the major protein component of HDL-C and the ratio of Apo B to Apo A1 has been shown to be predictive of coronary heart disease.6
--Apo C3 is an important mediator of triglyceride metabolism, and increases in Apo C3 have been noted in patients with hypertriglyceridemia.7
We compared serum lipid parameters, including TC, LDL-C, HDL-C, TG, hs-CRP, Apo A1, Apo B and Apo C3 levels, for subjects treated with an LPV/r-based induction-maintenance regimen versus an EFV-based combination regimen in a randomized controlled prospective study through 96 weeks of therapy.
METHODS
In Study M03-613, 155 antiretroviral-naive HIV-1 infected subjects were randomized to LPV/r + ZDV/3TC induction for 24- 48 weeks followed by LPV/r monotherapy if 3 consecutive HIV-1 RNA values <50 copies/mL were achieved
(n=104), or EFV + ZDV/3TC for the entire study period (n=51) in a 96-week study (Figure 1).
Figure 1. Study M03-613 Design
Deintensification starting at Week 24 if 3 consecutive monthly HIV-1 RNA levels <50 copies/mL

Inclusion criteria
- Antiretroviral-naive
- HIV-1 RNA >1000 copies/mL
- Any CD4 count
- No resistance to study drugs
The following measurements were obtained during the study: TC, TG, HDL-C, LDL-C at baseline and Week 4, 12, 24, 36, 48, 60, 72, 88 and 96; Apo A1, Apo B, Apo C3 and hs-CRP at baseline and Week 24, 36, 48, 72 and 96.
Mean change from baseline to each visit for lipid parameters was analyzed using a one-way analysis of variance. The relationship between demographics (including race, gender, age and weight) and baseline characteristics (including baseline HIV-1 RNA level and CD4+ T-cell count, as well as baseline lipid and lipoprotein values) and the change from baseline to Week 96 in TC and TG were assessed by linear regression and/or analysis of variance.
RESULTS
92 (88%) of 104 subjects randomized to LPV/r + ZDV/3TC achieved 3 consecutive HIV-1 RNA levels <50 copies/mL,
Baseline Demographics
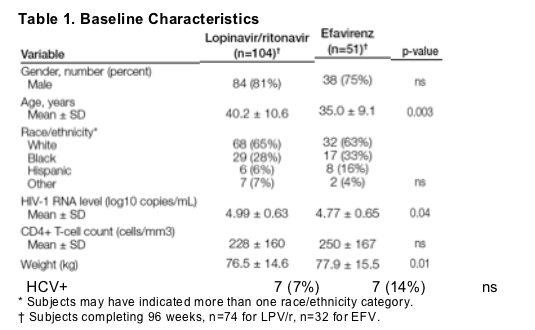
Demographics and baseline characteristics are displayed in Table 1.

Comparison of baseline metabolic parameters, including TC, LDL-C, HDL-C, LDL:HDL ratio, TG, hs-CRP, Apo A1, Apo B and Apo C3 levels revealed no differences between treatment groups.
Changes from Baseline in Lipid Parameters
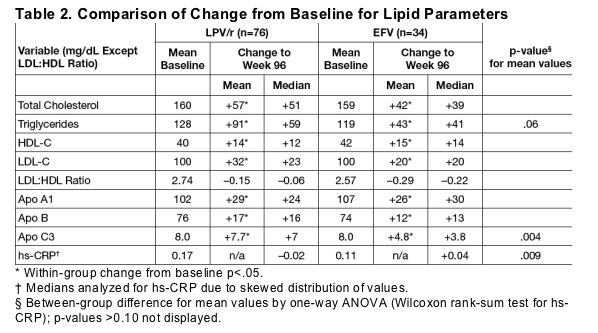
In subjects completing 96 weeks, baseline and changes from baseline were similar between treatment groups except for larger increases in Apo C3 in the LPV/r arm and trends toward a greater increase in TG and a greater decrease in hs-CRP in the LPV/r arm (Table 2).

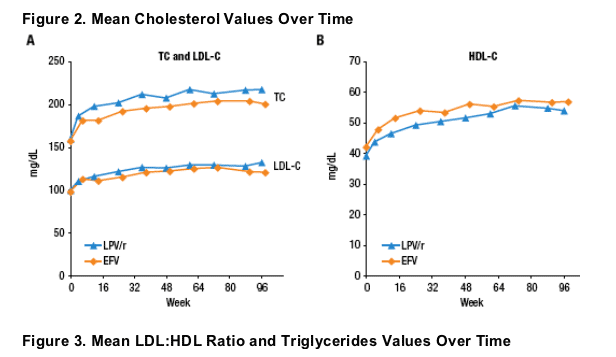
Mean changes from baseline over time in TC, LDL-C and HDL-C are displayed in Figure 2.
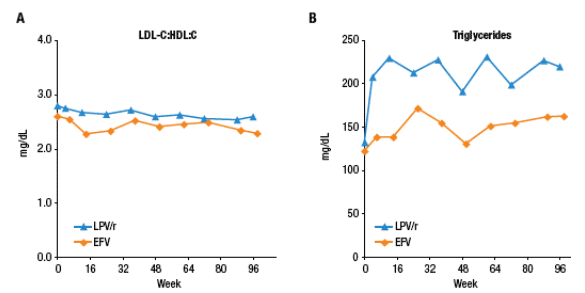
Mean LDL:HDL values and TG values are displayed in Figure 3.


Despite increases in TC and LDL, LDL:HDL ratio did not increase and was similar through 96 weeks for both regimens.
Apo B increased modestly in both treatment groups through Week 96 and was not significantly different between treatment groups. No significant differences
were observed between or within groups for the mean change from baseline to Week 96 in ApoB:ApoA1 ratio.
Changes from baseline generally occurred within the first 24 weeks and remained stable thereafter for both treatment groups.
Discontinuation of ZDV/3TC did not result in changes in lipid parameters for the LPV/r induction/maintenance group since lipid parameters remained stable after Week 24 of the study when the majority of subjects simplified to LPV/r monotherapy.
Results were similar if subjects who used lipid-lowering agents at any point during the study were excluded from the analysis.
Identification of Subjects with Sustained Increases in
TC and TG
Five percent of subjects in the LPV/r and 4% of subjects in the EFV-treatment groups had persistent elevations in TC defined as 3 consecutive grade 3+ (>300 mg/dl or 7.8 mmol/L) elevations. All such subjects had higher baseline TC values (mean of 221, minimum of 192 mg/dL) compared to the overall group (mean of 160 mg/dL).
One percent of subjects in the LPV/r group with a baseline TG level >350 mg/dL had persistent elevations in TG defined as 3 consecutive grade 3+ (>750 mg/dL or 8.5 mmol/L) elevations.
Association of Changes in Lipid Parameters with Baseline Variables
No baseline variable was significantly correlated with either TC or TG changes from baseline to Week 96.
Evaluation of hs-CRP
A significant difference between groups was observed in the change from baseline to Week 96, with median changes of - 0.02 mg/dL in the LPV/r group and +0.04 mg/dL (p=0.009, Wilcoxon rank-sum test).
At Week 96, 4 subjects in the LPV/r group (5%) and 2 in the EFV group (6%) had hs-CRP values >1.0 mg/dL. No subject had hs-CRP >3.0 mg/dL at Week 96.
|
| |
|
 |
 |
|
|