 |
 |
 |
| |
Resistance mutations detected by OLA of HIV-1 DNA at the initiation of nevirapine containing ART are associated with virologic failure
|
| |
| |
Reported by Jules Levin
18th Intl HIV Drug resistance Workshop
June 9-12 2009, Ft Myers Florida
T. Wagner1, G. Jourdain2,3, N. Ngo-Giang-Huong2,3, W. Sirungsi4, V. Klinbuayaem5, F. Fregonese6, I. Nantasen2, G. Halue8, M. Techpornroong7, A. Nilmanat9, P. Wittayapraparat10, V. Chalermpolprapa11, P. Pathipvanich12, P. Yuthavisuthi7, L. Frenkel1, M. Lallemant2,3
1. University of Washington and Seattle Children's Research Institute, Seattle, WA, USA
2. Institut de Recherche pour le Développement (IRD), UMI 174/PHPT, Thailand, France
3. Harvard School of Public Health, Boston, MA, USA
4. Faculty of Associated Medical Sciences, Chiang Mai University, Thailand
5. Sanpatong Hospital, Chiang Mai, Thailand
6. Padova University, Padova, Italy
7. Prapokklao Regional Hospital, Dept. of Obstetrics, Chantaburi, Thailand
8. Provincial Hospital, Dept. of Internal Medicine, Phayao, Thailand
9. Hat Yai Regional Hospital, Dept. of Internal Medicine, Songkla, Thailand
10. Provincial Hospital, Dept. of Internal Medicine, Chacheongsao, Thailand
11. Regional Hospital, Dept. of Obstetrics, Nakhonpathom, Thailand
12. Lampang Hospital, Lampang, Thailand
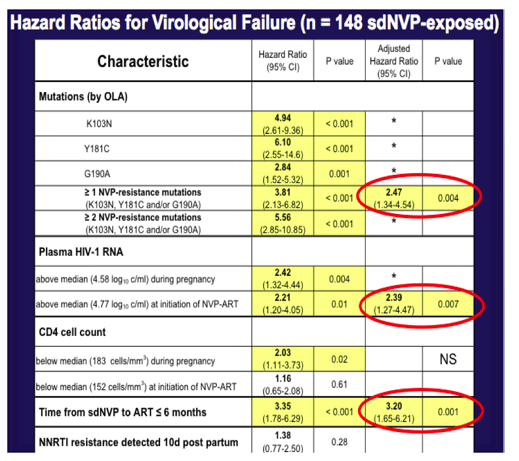
This is the primary analysis. It shows the association between pre-ART OLA and ART outcome.
VF was defined as repeated VL > 50 between 6 -18 mon after starting ART.
In univariate analysis each one of the resistance codons was associated with treatment failure, and more than one mutation was associated with increased hazard ratio for failurel.
In MV analysis, virologic failure was associated with having a resistance mutation by OLA, which was our primary outcome and circled in red. Virologic failure was also associated with pre-ART viral load and time from sdNVP to ART.
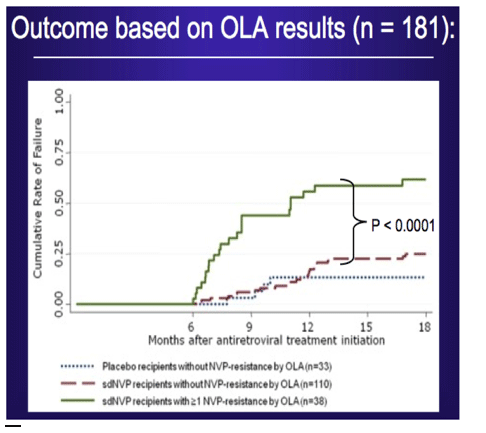
This is the best summary graphic.
It shows Kaplan-Meier estimates of virologic failure between 6 and 18 months after initiating a nevirapine based antiretroviral treatment.
1. This graph shows a clear difference between the women exposed to NVP with resistance before ART by OLA (green line) and without resistance detected (red dashed line), which was statistically significant.
2. Both of the NVP exposed groups fail at a higher rate than the placebo exposed group (blue dotted line), although the difference between the placebo arm and the arm that were NVP exposed without resistance by OLA was not statistically significant.
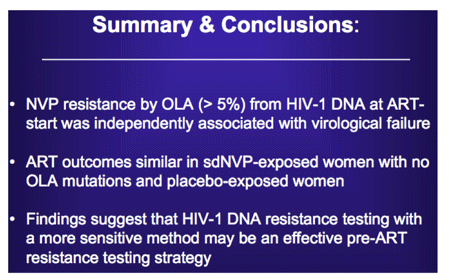
3. This suggest that resistance testing may be able to identify most of the women at risk of virologic failure because of previous sdNVP exposure
|
| |
|
 |
 |
|
|