| |
Relative Muscle Mass Is Inversely Associated with Insulin Resistance and Prediabetes. Findings from The Third National Health and Nutrition Examination Survey
|
| |
| |
Download the PDF here
J Clin Endocrin Metab. First published ahead of print July 21, 2011
Preethi Srikanthan and Arun S. Karlamangla
Divisions of Endocrinology (P.S.) and Geriatrics (A.S.K.), Department of Medicine, David Geffen School of Medicine, Los Angeles, California 90095-1679
"potential role for muscle-building exercises in preventing metabolic dysfunction. However, prospective studies of short-term strength training interventions in overweight and obese individuals have been equivocal with respect to their effect on metabolic abnormalities (24, 25). Further work is required to determine the nature and duration of exercise interventions required to improve insulin sensitivity and glucose metabolism in both high-risk and moderate-risk individuals."
ABSTRACT
Context: Insulin resistance, the basis of type 2 diabetes, is rapidly increasing in prevalence; very low muscle mass is a risk factor for insulin resistance.
Objective: The aim was to determine whether increases in muscle mass at average and above average levels are associated with improved glucose regulation.
Design: We conducted a cross-sectional analysis of National Health and Nutrition Examination Survey III data.
Participants: Data from 13,644 subjects in a national study were evaluated.
Outcome Measurements: We measured homeostasis model assessment of insulin resistance (HOMA-IR), blood glycosylated hemoglobin level, prevalence of transitional/pre- or overt diabetes (PDM), and prevalence of overt diabetes mellitus.
Results: All four outcomes decreased from the lowest quartile to the highest quartile of skeletal muscle index (SMI), the ratio of total skeletal muscle mass (estimated by bioelectrical impedance) to total body weight. After adjusting for age, ethnicity, sex, and generalized and central obesity, each 10% increase in SMI was associated with 11% relative reduction in HOMA-IR (95% confidence interval, 6 -15%) and 12% relative reduction in PDM prevalence (95% CI, 1-21%). In nondiabetics, SMI associations with HOMA-IR and PDM prevalence were stronger.
Conclusions: Across the full range, higher muscle mass (relative to body size) is associated with better insulin sensitivity and lower risk of PDM. Further research is needed to examine the effect of appropriate exercise interventions designed to increase muscle mass on incidence of diabetes.
Introduction
Design and methods
With recent dramatic increases in obesity, both in the United States and in developing societies, the worldwide growth in the prevalence of diabetes, a major source of cardiovascular morbidity and health expenditure, is expected to accelerate. It is thus imperative that all major factors that contribute to the development of diabetes mellitus (DM) are identified. The adverse impact of sarcopenia, or low muscle mass, on insulin resistance and diabetes is now recognized (1-3). However, it is not known whether muscle mass has any impact on insulin resistance and diabetes risk outside the context of sarcopenia. Specifically, it is not known whether increasing muscle mass beyond the sarcopenic range increases insulin sensitivity and affords protection against incidence of diabetes. Because muscle is the primary tissue contributing to whole-body insulin-mediated glucose disposal, we hypothesized that insulin sensitivity would increase and dysglycemia would decrease with increases in whole-body skeletal muscle mass as a fraction of total body mass. To test this hypothesis, we examined the associations of skeletal muscle mass [assessed by bioelectrical impedance (BI) measurement] with insulin resistance and dysglycemia in a nationally representative sample.
Design & Methods
The Third National Health and Nutrition Examination Sur- vey (NHANES III) was a national survey conducted from 1988 through 1994 using a stratified, multistage, probability cluster design. The total sample included 33,199 persons (4), of whom 17,756 were older than 20 yr of age and were not pregnant. The full evaluation included a standardized home interview (with a medication review), a physical examination in a mobile exami- nation center (MEC), and a fasting blood draw.
Our analytic sample (n =13,644) was restricted to those who were older than 20 yr and were not pregnant; had measurements of bioelectrical impedance (BI), body height, waist circumfer- ence, and body weight; had body mass index (BMI) of at least 16 kg/m2 and body weight more than 35 kg; and were without self-reported cardiac failure. BI relies on the relationship between body composition and body water content, and this may be disturbed in pathological states that increase whole body water, such as cardiac failure. Participants who had cardiac pacemakers or had previously undergone limb amputation were excluded from the measurement of BI (5).
Measurements
Exposures
BI was measured using the Valhalla Scientific Body Composition Analyzer 1990 B (6) and was used to estimate total skeletal muscle mass (in kilograms) via the following BI analysis equation of Janssen et al. (7): Skeletal muscle mass [0.401 (height2/ BI) (3.825 sex) (0.071 age)] 5.102, with height measured in centimeters, BI measured in ohms, sex coded 1 for men and 0 for women, and age measured in years. Skeletal muscle index (SMI) is the ratio of estimated skeletal muscle mass to total body weight, expressed as a percentage. Muscle mass index (MMI) is the ratio of skeletal muscle mass to the square of body height in kilograms per square meter.
Outcomes
Serum insulin and plasma glucose were measured from fasting blood samples (from participants who had fasted 6 h or more) using RIA and a hexokinase enzymatic method, respectively (5), and were used to calculate insulin resistance by the homeostasis model assessment of insulin resistance (HOMA-IR), which is approximated using the following formula for participants whose fasting plasma glucose ranged from 3.0 to 25.0 mmol/liter and whose fasting insulin ranged from 3 to 55 U/ml (8): HOMA-IR = fasting glucose (in mmol/liter) x fasting insulin (in U/ml)/22.5.
Glycosylated hemoglobin (HbA1C) was measured using an ion-exchange HPLC method with a Diamat Analyzer System and was used to define dysglycemia based on standard HbA1C thresholds (9). Specifically, DM was defined by the presence of one or more of the following conditions: 1) HbA1C of at least 6.5%; 2) fasting glucose of at least 7 mmol/liter (126 mg/dl); 3) self-report of diabetes; or 4) use of diabetes medications (oral hypoglycemic agents and/or insulin). The more inclusive condi- tion of transitional/pre- or overt diabetes (PDM) was defined by the presence of one or more of the following: 1) HbA1C of at least 6%; 2) fasting glucose of at least 5.5 mmol/liter (100 mg/dl); 3) self-report of diabetes; or 4) use of diabetes medications.
Covariates
Age, race/ethnicity (non-Hispanic white, non-Hispanic black, Mexican-American, and other), and sex were obtained from self-reports. Waist circumference, body height, and body weight were measured, and BMI was calculated. Generalized obesity was defined as BMI of at least 30 kg/m2, overweight as BMI between 25 and 30 kg/m2, and central obesity as waist circumference greater than 88 cm in women and greater than 102 cm in men.
Results
The study sample was representative of the complete NHANES sample that was nonpregnant and 20 yr or older (Table 1), except that the study participants had lower prevalence of DM. The average age of participants in the study sample was 41 yr; 48.9% were male, and 77.2% were non-Hispanic Whites.
In unadjusted analyses, all four outcomes (HOMA-IR, HbA1C, PDM prevalence, and DM prevalence) decreased substantially from the lowest SMI quartile to the highest (Table 2). The smallest effect size was for HbA1C, with 5.8% relative reduction in geometric mean from lowest to highest SMI quartile (5.49 to 5.17%). The most striking effect was in DM prevalence, with relative reduction of 63%: DM prevalence was 14.5% in the lowest SMI quartile and only 5.3% in the highest quartile. Reductions in all four outcomes from the third highest to the top quartile of SMI were also statistically significant .These associations persisted when diabetics were excluded from the analytic sample (Table 2). The relationships between SMI and both HOMA-IR and HbA1C were also seen in local regression (LOESS) plots with SMI as continuous predictor (Fig. 1).
Associations with HOMA-IR and PDM prevalence persisted after adjustment for age, sex, race/ethnicity, gen- eralized obesity and overweight status, and central obesity (Table 3.) In addition to strong and significant trends in both outcomes from lowest to highest quartile of SMI,
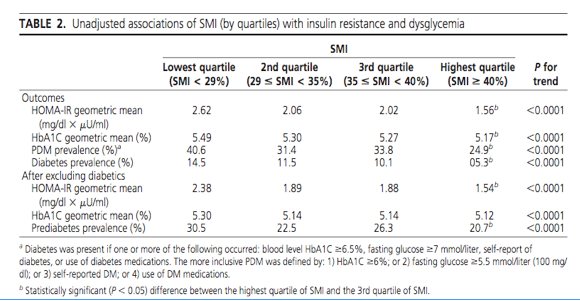
there was significant reduction from the third highest to the top quartile: HOMA-IR ratio, 0.86 [95% confidence interval (CI), 0.82- 0.90] and PDM prevalence ratio, 0.83 (95% CI, 0.72-0.96). Associations were even stronger when participants with diabetes were excluded to reduce confounding by reverse causation (i.e. diabetes leading to decreased SMI; see Table 2).
Based on these findings, we reran the models with SMI as continuous predictor for outcomes that had shown significant linear trends across SMI quartiles and included adjustment for age, sex, race/ethnicity, continuous BMI, generalized obesity and overweight status, and central obesity. Adjusted associations (per 10% increase in SMI) are presented in Table 4. After excluding participants with overt diabetes, per 10% increment in SMI, there was a 14% relative reduction in HOMA-IR (95% CI, 10 -18%) and 23% relative reduction in PDM prevalence (95% CI, 11-33%).
Analyses with MMI as the continuous predictor (to test whether findings were sensitive to weight vs. height normalization of total muscle mass), adjusted for the same covariates, showed a nearly identical pattern of associations as SMI (Table 4). After excluding participants with overt diabetes, each 1 kg/m2 increment in MMI was as- sociated with 4% relative reduction in HOMA-IR (95% CI, 3- 6%), 0.3% relative reduction in HbA1C (95% CI, 0.1- 0.6%), and 9% relative reduction in PDM prevalence (95% CI, 4-13%).
Discussion
As hypothesized, skeletal muscle mass relative to body weight was found to be inversely associated with insulin resistance and the risk of prediabetes. This inverse relationship was not limited to the lower, sarcopenic end of the muscle mass distribution in the population, but was seen over the whole range so that increases in muscle mass above even average levels were associated with additional protection against insulin resistance and prediabetes. This is analogous to the relationship between social status and health, where there is a continuous gradient between socioeconomic status (SES) and a variety of health outcomes over the full range of SES, and SES associations with health are not restricted to health differences between those living in poverty and everyone else (11, 12).
These protective associations of increased muscle mass were stronger in those without overt diabetes. In nondiabetics, relative muscle mass also had an inverse association with level of glycemia. The somewhat weaker associations when diabetics were included in the analytic sample are likely the result of the effects of diabetes on muscle mass and on pancreatic beta-cell mass. It is known that the pathophysiology of DM causes atrophy of muscles, due to declines in the activity of anabolic hormones (e.g. IGF-I, testosterone, ghrelin), increased inflammation (13), increased expression of acrogens that increase protein deg- radation (14), and the detrimental effects of DM on blood supply to muscle (14, 15). On the other hand, insulin is known to inhibit proteolysis and enhance protein synthesis, and it has been suggested that exogenous insulin and agents that enhance insulin activity increase muscle protein synthetic activity (16, 17) and suppress muscle protein breakdown (18). It should be noted that DM is also characterized by decreased functional beta-cell mass and inadequate insulin secretion (19, 20). Thus, increased glycemia in DM is the result not only of increased insulin resistance (which is related to decline in muscle mass) but also of decreased beta-cell function (21). The latter mechanism is not directly related to muscle mass and would be expected to weaken muscle mass associations with glycemia in diabetic individuals.
Our findings are consistent with the previous finding in older men from the Florey Adelaide Male Ageing Study of an inverse relationship between metabolic syndrome and muscle mass (3). In our study, we found inverse associations between relative muscle mass and insulin resistance, prediabetes prevalence, and level of prediabetic glycemia in a large, nationally representative sample that included men and women, young and old. These associations were seen over the whole range of relative muscle mass, and effect sizes were fairly large. For instance, a 3% increment in muscle mass as a fraction of body weight was associated with 3.4% relative reduction in HOMA-IR and 3.7% in prevalence of PDM. In nondiabetics, the effects were even larger: 4.4% relative reduction in HOMA-IR and 7.5% relative reduction in prediabetes risk.
Our study had some limitations. First, the cross-sectional nature of the study limits our ability to draw causal inferences from the relationships observed. However, the strength of the observed associations and their persistence after exclusion of individuals with overt diabetes bolster the case for a causal effect of muscle mass on insulin sensitivity and glycemic control. Another possibility is that low muscle mass and metabolic dysfunction result from a common pathology, such as family environment in childhood, diet, exercise, SES, and common gene variants including sirtuin-1 genes, which have been implicated in both prevention of low muscle mass and maintenance of insulin sensitivity (22, 23). Second, we used BI to estimate muscle mass. BI-based muscle mass measurement relies on the relationship between body composition and body wa- ter content, which may be disturbed in pathological states that increase whole body water, such as cardiac or renal failure. Individuals with heart failure were excluded from this sample; however, in individuals with renal disease, muscle mass would be overestimated. Third, we could not differentiate between type 1 diabetes and type 2 diabetes. Because in type 1 DM the primary pathology is loss of beta-cell function, rather than increased insulin resistance, individuals with type 1 diabetes may be less affected by alterations in muscle mass, and their inclusion likely weak- ened muscle mass associations with glycemia. Finally, individuals with high relative muscle mass have low relative fat mass; thus, associations seen here may reflect the insulin resistance of adipose tissue. To discount this possi- bility, we controlled for clinically relevant measures of both generalized and central obesity in all analyses. However, because this study did not have more direct measures of fat mass, we cannot completely control for confounding by fat mass and cannot definitively establish that higher relative muscle mass protects against insulin resistance and dysglycemia.
Despite these limitations, this study does definitively establish that, independent of currently used clinical measures of generalized and central obesity, muscle mass rel- ative to body size predicts the level of insulin resistance and risk of prediabetes over the full range of muscle mass, and that this association is not limited to the sarcopenic end of the relative muscle mass distribution. This underscores the public health importance of monitoring muscle mass (relative to body size) in addition to BMI and waist circumference in assessing an individual's metabolic health, and it suggests a potential role for muscle-building exercises in preventing metabolic dysfunction. However, prospective studies of short-term strength training interventions in overweight and obese individuals have been equivocal with respect to their effect on metabolic abnormalities (24, 25). Further work is required to determine the nature and duration of exercise interventions required to improve insulin sensitivity and glucose metabolism in both high-risk and moderate-risk individuals.
|
|
| |
| |
|
|
|


