| |
Economic burden associated with diagnosed diabetes (all ages) and undiagnosed diabetes, GDM, and prediabetes (adults) is estimated to be $322 billion
|
| |
| |
Download the PDF here
Diabetes increases the risk for ocular, renal, neurologic, cardiovascular, peripheral vascular, and metabolic conditions; these conditions increase the risk for premature mortality and medical expenditures, while they reduce employment, productivity, and quality of life.......(CDC) estimates that 29.1 million people in the U.S. had diabetes in 2012, among whom there were 8.1 million undiagnosed cases (5). The estimated economic burden of diagnosed diabetes in 2012 consists of $176 billion in higher medical costs and $69 billion in lower productivity (3). This $245 billion represents a 41% increase from the 2007 burden estimate of $174 billion (4). Of this 41% increase, 27% is attributed to growth in the prevalence of diagnosed diabetes, and 14% to growth in the average cost per case. The estimated burden of undiagnosed diabetes in 2007 was $18 billion (6).
The large economic burden associated with diagnosed diabetes (all ages) and undiagnosed diabetes, GDM, and prediabetes (adults) is estimated to be $322 billion in 2012, including $244 billion in higher medical expenditures and $78 billion in reduced productivity. This annual burden exceeds $1,000 for each person in the U.S. The sobering statistics presented in this study underscore the urgency to better understand the cost mitigation potential of prevention and treatment strategies.
Prediabetes is a term used for individuals whose glucose levels do not meet the criteria for diabetes, but are too high to be considered normal. These individuals are defined as having impaired fasting glucose (fasting plasma glucose [FPG] level 100-125 mg/dL [5.6-6.9 mmol/L]), impaired glucose tolerance (2-h plasma oral glucose tolerance test [OGTT] level 140-199 mg/dL [7.8-11 mmol/L]), and/or an A1C value of 5.7-6.4% (1). Prediabetes is a risk factor for diabetes and cardiovascular disease, and research finds that complications associated with diabetes are present among people with undiagnosed diabetes and prediabetes at higher rates than among people with normal glucose levels (7). The CDC estimates that 86 million adults had prediabetes in 2012 (5). In 2007, 57 million adults had prediabetes, with estimated prediabetes-associated medical costs of $25 billion (7).
--------------------
The Economic Burden of Elevated Blood Glucose Levels in 2012: Diagnosed and Undiagnosed Diabetes, Gestational Diabetes Mellitus, and Prediabetes
Diabetes Care 2014
Timothy M. Dall,1 Wenya Yang,2 Pragna Halder,2 Bo Pang,2 Marjan Massoudi,3 Neil Wintfeld,3 April P. Semilla,1 Jerry Franz,3 and Paul F. Hogan2
Abstract
OBJECTIVE To update estimates of the economic burden of undiagnosed diabetes, prediabetes, and gestational diabetes mellitus in 2012 in the U.S. and to present state-level estimates. Combined with published estimates for diagnosed diabetes, these statistics provide a detailed picture of the economic costs associated with elevated glucose levels.
RESEARCH DESIGN AND METHODS This study estimated health care use and medical expenditures in excess of expected levels occurring in the absence of diabetes or prediabetes. Data sources that were analyzed include Optum medical claims for ~4.9 million commercially insured patients who were continuously enrolled from 2010 to 2012, Medicare Standard Analytical Files containing medical claims for ~2.6 million Medicare patients in 2011, and the 2010 Nationwide Inpatient Sample containing ~7.8 million hospital discharge records. The indirect economic burden includes reduced labor force participation, missed workdays, and reduced productivity. State-level estimates reflect geographic variation in prevalence, risk factors, and prices.
RESULTS The economic burden associated with diagnosed diabetes (all ages) and undiagnosed diabetes, gestational diabetes, and prediabetes (adults) exceeded $322 billion in 2012, consisting of $244 billion in excess medical costs and $78 billion in reduced productivity. Combined, this amounts to an economic burden exceeding $1,000 for each American in 2012. This national estimate is 48% higher than the $218 billion estimate for 2007. The burden per case averaged $10,970 for diagnosed diabetes, $5,800 for gestational diabetes, $4,030 for undiagnosed diabetes, and $510 for prediabetes.
CONCLUSIONS These statistics underscore the importance of finding ways to reduce the burden of prediabetes and diabetes through prevention and treatment.
Introduction
Diabetes is a metabolic condition that is characterized by elevated blood glucose level due to insufficient insulin production and/or peripheral tissue resistance to the action of insulin. Diabetes increases the risk for ocular, renal, neurologic, cardiovascular, peripheral vascular, and metabolic conditions; these conditions increase the risk for premature mortality and medical expenditures, while they reduce employment, productivity, and quality of life (1-4). The Centers for Disease Control and Prevention (CDC) estimates that 29.1 million people in the U.S. had diabetes in 2012, among whom there were 8.1 million undiagnosed cases (5). The estimated economic burden of diagnosed diabetes in 2012 consists of $176 billion in higher medical costs and $69 billion in lower productivity (3). This $245 billion represents a 41% increase from the 2007 burden estimate of $174 billion (4). Of this 41% increase, 27% is attributed to growth in the prevalence of diagnosed diabetes, and 14% to growth in the average cost per case. The estimated burden of undiagnosed diabetes in 2007 was $18 billion (6).
Prediabetes is a term used for individuals whose glucose levels do not meet the criteria for diabetes, but are too high to be considered normal. These individuals are defined as having impaired fasting glucose (fasting plasma glucose [FPG] level 100-125 mg/dL [5.6-6.9 mmol/L]), impaired glucose tolerance (2-h plasma oral glucose tolerance test [OGTT] level 140-199 mg/dL [7.8-11 mmol/L]), and/or an A1C value of 5.7-6.4% (1). Prediabetes is a risk factor for diabetes and cardiovascular disease, and research finds that complications associated with diabetes are present among people with undiagnosed diabetes and prediabetes at higher rates than among people with normal glucose levels (7). The CDC estimates that 86 million adults had prediabetes in 2012 (5). In 2007, 57 million adults had prediabetes, with estimated prediabetes-associated medical costs of $25 billion (7).
Gestational diabetes mellitus (GDM), diabetes that is diagnosed during pregnancy and is not clearly overt diabetes, is diagnosed in 2-10% of pregnant women (8). Type 2 diabetes ultimately develops in about one-half of all women who have GDM (9). In 2007, GDM in mothers of ~180,000 delivered newborns was associated with $636 million in increased medical costs (10).
In 2007, the estimated economic burden from elevated blood glucose levels (diagnosed and undiagnosed diabetes, prediabetes, and GDM) reached $218 billion in the form of higher medical costs ($153 billion) and reduced productivity ($65 billion), representing a burden of ~$700 annually per American (2).
This article updates the 2007 estimates of economic burden associated with undiagnosed diabetes, prediabetes, and GDM, which combined with the American Diabetes Association (ADA) 2012 burden estimate for diagnosed diabetes provides a more complete picture of the national economic burden associated with elevated blood glucose levels in 2012 (2,3). Furthermore, state-level prevalence and burden estimates are presented. A better understanding of the health and economic burden associated with these different categories of diabetes and prediabetes could help to inform national and state policies and resource allocation decisions aimed at prevention and treatment.
Research Design and Methods
The data sources and methods used to calculate national economic burden have been published elsewhere (2-4,6,7,10). We provide a brief overview of the data and methods used to calculate national and state economic burdens, with additional details provided in the Supplementary Data. All costs are reported in 2012 dollars. State-level estimates reflect geographic differences in risk factors for diabetes and differences in medical and labor costs (11).
Estimating Disease Prevalence
National prevalence estimates for undiagnosed diabetes and prediabetes for adults were recently published by the CDC (5). To estimate disease prevalence by state, we combined information from the 2012 American Community Survey (n = 2,375,715), 2011 and 2012 Behavioral Risk Factor Surveillance System data (n = 982,154), and information from the 2004 National Nursing Home Survey (n = 14,017) (see Supplementary Data for database construction methods). The resulting population database contained self-reported diagnosed diabetes status, diabetes risk factors, and demographics for a representative sample of each state�s population in 2012.
The National Health and Nutrition Examination Survey (NHANES) is a nationally representative sample of the noninstitutionalized population, with the combined 2003-2010 files containing 19,056 adults with laboratory results for detecting diabetes or prediabetes status (12). Using NHANES data, we developed a predictive model for the prevalence of prediabetes and undiagnosed diabetes among adults, which we applied to the constructed state population database. Approximately one-third of NHANES adults undergo laboratory tests that can indicate diabetes or prediabetes. The sample of 19,056 adults excludes 425 women who indicated they were pregnant at the time of their laboratory test and 2,300 adults who indicated having previously received a diagnosis of diabetes or who reported taking insulin. Following the approach used by the CDC to calculate national prevalence estimates, all remaining adults were categorized as having undiagnosed diabetes, prediabetes, or normal glucose levels based on laboratory results (A1C or FPG).
The predictive model used polytomous logistic regression, which allowed the dependent variable to have the following three values: normal glucose levels, prediabetes, and diabetes (undiagnosed) (13). Explanatory variables reflect risk factors for diabetes that are common to both NHANES and the constructed population database (see Supplementary Data for predictive model results) (14-17). We applied the predictive model to the constructed population database to generate individual probabilities of undiagnosed diabetes and prediabetes. For each state, we calculated the prevalence of undiagnosed diabetes and prediabetes by aggregating probabilities from the predictive model. Diagnosed diabetes estimates by state reflect patient self-response to the Behavioral Risk Factor Surveillance System question asking whether subjects had previously been told by a health professional that they had diabetes.
State-level estimates of GDM were based on the 2010 Nationwide Inpatient Sample (NIS; n = 98,289 births with GDM, of 1.8 million total births), with GDM cases identified by ICD-9 diagnosis code (648.8x) and excluding women with diagnosed type 1 or type 2 diabetes. We estimated the percentage of births where the mother has GDM by mother�s age (<20, 20-24, 25-29, 30-34, 35-39, and 40+ years of age), and then multiplied these percentages with published statistics for 2011 on total live births in each state by the mother�s age. Statistics for 2011 were scaled to 2012 based on state birth statistics. NIS data were unavailable for Alabama, Delaware, District of Columbia, Idaho, and North Dakota, so for these geographic areas we assumed regional averages for GDM prevalence rates by the mother�s age.
Estimating Health Care Use and Costs
The approach estimates health care use in excess of the levels that would occur in the absence of diabetes (to model undiagnosed diabetes) or prediabetes (to model prediabetes). Data sources analyzed include the 2010 NIS (n = 7,800,441 hospital discharges); the 2008-2010 National Ambulatory Medical Care Survey (n = 92,251); the 2007-2009 National Hospital Ambulatory Medical Care Survey (n = 207,968); the 2006-2010 Medical Expenditure Panel Survey (MEPS; n = 167,876); the Optum deidentified Normative Health Information database (dNHI; n = 4,870,413), which contains all medical claims for a commercially insured population continuously enrolled from January 2010 through December 2012; and the 2011 Medicare Standard Analytical Files (SAFs; n = 2,580,254).
Identifying Patients by Diabetes Category to Analyze Health Care Use Patterns
The analysis of health care use patterns for people with diagnosed diabetes, compared with everyone else, used the presence of any ICD-9 diagnosis code for diabetes (250.xx) in the dNHI and Medicare SAFs to categorize a person as having diabetes (3,4). This approach maintained consistency with that used in previous studies, and it reflects that the Medicare SAFs do not contain laboratory values or pharmacy claims to identify whether a person is using insulin or other injectable products, and/or oral agents. That a person with only one medical claim indicating diabetes could be placed in the diabetes category likely reduces the estimated diabetes impact on health care use, as a person without diabetes could inadvertently be categorized as having diabetes, thus diluting the diabetes sample. Using additional criteria to categorize a person with diabetes (e.g., two or more diagnosis codes for diabetes) could result in selecting a subset of the diabetes population that is less healthy and thus overstate the impact of diabetes on health care use patterns.
For the undiagnosed diabetes analysis, we identified a proxy population of adults in the dNHI who were on the verge of diagnosis (6). To identify the proxy population, we included patients who were continuously enrolled from 2010 through 2012, had been identified as having diabetes in 2012 based on the �strict� criteria (have at least one claim of anti-hyperglycemic therapy; have at least one visit diagnosed as diabetes [ICD-9 codes 250.xx] in an inpatient, emergency, hospice, or skilled nursing facility setting; have at least two visits diagnosed as diabetes from an ambulatory setting; or have at least one of the three test values shown as diabetic [A1C >6.4%, OGTT ≥200 mg/dL, FPG ≥126 mg/dL] [14]), but had no indication of diabetes in 2010 or 2011 based on �loose� criteria (have at least one claim of anti-hyperglycemic therapy; have at least one visit diagnosed as diabetes from any type of service; or have at least one of the three test values shown as diabetic [A1C >6.4%, OGTT ≥200 mg/dL, FG ≥126 mg/dL]). We compared their health care use patterns in 2010 and 2011 to patients with no history of diabetes between 2010 and 2012.
This approach likely produces conservative results because inadvertently categorizing a person as diabetic based on a single laboratory result or a single claim could dilute the population designated as previously undiagnosed with people who do not have diabetes in 2012.
The prediabetes population consists of patients in the dNHI with a claims history of impaired fasting glucose or glucose tolerance test (ICD-9 diagnosis codes 790.21 and 790.22), or results of laboratory tests that were within the prediabetes range (14). As suggested by the literature, the control group included patients with no claim for A1C, FPG, or OGTT (7). We used data from 1 year to categorize patients (2010 or 2011) and medical claims in the following year (2011 or 2012) to analyze health care use.
Women in the dNHI who gave birth in 2011 were identified with GDM using an ICD-9 diagnosis code (648.8x). The sample (n = 16,902) consists of mother-child pairs where the mother was continuously enrolled for 271 days prior to delivery and 365 days after delivery. The control group was mothers (and their newborns) with no indication of GDM. We compared the health care use of mothers from 9 months prior to childbirth through 12 months after childbirth. We compared use for newborns for 12 months after birth. Women with GDM were excluded from the study, and control groups for the analyses of diagnosed and undiagnosed diabetes, and prediabetes, and patients with diabetes were excluded from the study for GDM.
Estimating Excess Use of Health Care Services and Medical Costs
We estimated rate ratios for undiagnosed diabetes, prediabetes, and GDM using Poisson regression with dNHI data where the dependent variable was annual health care use (ambulatory visits, emergency visits, and inpatient days by comorbidity category) (6,7,10). The rate ratios reflect the annual use of services for a person with diabetes (or prediabetes) relative to a person without diabetes (or no indication of prediabetes). The regressions controlled for age group, sex, health insurance type, census region, year of health care use, and costly health conditions (HIV/AIDS, organ transplantation, cancer, and pregnancy [prediabetes and undiagnosed diabetes analyses]). Regressions for prediabetes also controlled for peripheral vascular disease, cardiovascular disease, hypertension, endocrine complications, and ophthalmic complications. Estimates of diabetes and prediabetes prevalence were combined with these health care use rate ratios to create etiological fractions that indicate the proportion of health care use in excess of levels expected among a population without diabetes (to model undiagnosed diabetes) or with no indication of prediabetes (to model prediabetes) (3,18). Separate etiological fractions were calculated by age group, care delivery setting (hospital inpatient, emergency departments, ambulatory visits), and medical condition (see Supplementary Data). Calculations for the diagnosed diabetes population are published elsewhere (3).
National total physician office visits, outpatient visits, emergency visits, and prescription drugs were estimated from National Ambulatory Medical Care Survey and National Hospital Ambulatory Medical Care Survey. NIS was the source of hospital inpatient use and cost. Estimates of expenditures related to health care settings, services, and products (prescriptions, medical equipment, and supplies) came from the MEPS.
Estimating Indirect Burden
We also estimated productivity loss associated with diagnosed and undiagnosed diabetes (3,6). Cost categories include reduced employment and reduced productivity while at work (presenteeism), increased absenteeism, reduced productivity for those not in the workforce, and early mortality. We analyzed the 2008-2010 National Health Interview Survey (n = 76,669) using logistic regression to estimate the increased risk of being out of the workforce and receiving payments for long-term disability associated with diabetes (controlling for age group, sex, race/ethnicity, hypertension, and body weight).
Annual missed work days were modeled using ordinary least-squares regression. Estimates of presenteeism came from published studies of the relationship between diagnosed diabetes and reduced productivity (19-22). Estimates of the increased mortality associated with diabetes and its sequelae were modeled for diagnosed diabetes only using data from the CDC 2009 Mortality Multiple Cause File (3).
Study Results
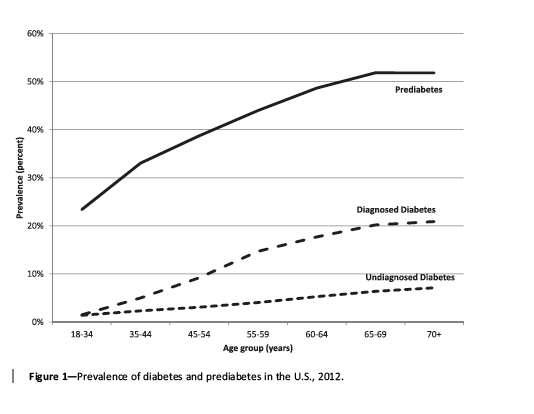
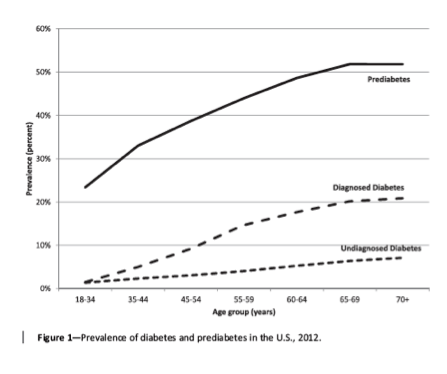
CDC reports that in 2012 there were ~29.1 million people with diabetes (21.0 million with diagnosed diabetes, and 8.1 million with undiagnosed diabetes) and 86 million adults with prediabetes in the U.S. (5). Estimates of the economic burden of diagnosed diabetes published by the ADA show 22.3 million people with diagnosed diabetes (6% higher than the CDC estimate) (3). The 21.0 million estimate is based on diabetes prevalence rates among a noninstitutionalized population, whereas the 22.3 million estimate uses prevalence rates calculated for the noninstitutionalized population but adjusted to account for the higher prevalence rate of diagnosed diabetes (32.8%) among people living in nursing homes, as determined by analysis of medical charts and prescription claims files (23). Prevalence rates for prediabetes, diagnosed diabetes, and undiagnosed diabetes rise with age (Fig. 1). Prediabetes is present in ~23% of adults under 34 years of age. Approximately three of every four adults ≥65 years of age have either prediabetes (51%) or diabetes (27%).
GDM prevalence rates from the NIS combined with Census Bureau birth data suggest that there were 222,000 GDM cases in 2012. The percentage of births among GDM mothers rises with the mother�s age, from a low of 1.5% for mothers under 20 years of age, to a high of 12.8% for mothers ≥40 years of age.
Similar to earlier work, we found statistically significant associations between diagnosed diabetes and higher health care use across delivery settings for many health conditions (including general medical conditions that are not explicit comorbidities of diabetes) (3,4). Undiagnosed diabetes and prediabetes are associated with higher use of ambulatory care. Care use was estimated using rate ratios�the annual use of care by people with the condition (e.g., diabetes) divided by the annual use of care by people without the condition. Adults 45-64 years of age with undiagnosed diabetes have 1.9 times the annual number of visits for cardiovascular disease and 1.6 times the number of visits for hypertension compared with a similar population without diabetes. Adults with prediabetes incur 1.8 times the annual number of ambulatory visits for endocrine complications and 1.5 times the number of visits for hypertension compared with a similar population with no indication of prediabetes. For both undiagnosed diabetes and prediabetes, most of the rate ratios were not statistically different from 1.0 for the emergency department and inpatient settings, so these ratios were assumed to be 1.0 for the analysis.
GDM significantly increases rates of hospital inpatient days for cesarean delivery, other adverse pregnancy-related events, and non-pregnancy-related general medical conditions affecting mothers. In addition, GDM also increases the number of mothers� ambulatory visits for treatment of urinary tract infection, amniotic cavity infection, preeclampsia, eclampsia, and other hypertension-complicating conditions in pregnancy. For newborns, mothers� GDM appears to increase the number of ambulatory visits for congenital anomalies, and other neonatal events identified by primary diagnosis, in addition to increased number of newborns� ambulatory visits for treatment of jaundice.
The national cost associated with elevated blood glucose levels in 2012 is $322 billion, including over $244 billion for diagnosed diabetes, $33 billion for undiagnosed diabetes, $44 billion for prediabetes, and $1.3 billion for GDM (Table 1). Prediabetes costs $510 annually per person (medical costs only); undiagnosed diabetes, $4,030; and diagnosed diabetes, $10,970. The cost of GDM per case averaged $5,800 in higher delivery costs and other costs during the newborn�s first year of life. Medical costs per case increase with age for diagnosed diabetes and prediabetes. For undiagnosed diabetes and GDM, the age pattern is less defined.
The diagnosed diabetes and GDM prevalence rates for each state, based on survey data and medical claims, show some geographic variation (Table 2). Diagnosed diabetes rates can differ slightly from CDC-reported rates because these numbers cover the entire population and not just the community-based population. Diagnosed prevalence rates are highest in many of the Southern states (Alabama, Florida, Kentucky, Mississippi) and West Virginia and lowest in Mountain and Western states (Alaska, Colorado, Montana, Utah), as well as Minnesota and Vermont (see Supplementary Data and Table 3). The GDM rate in Hawaii (8.7% of births) is substantially higher than that in Utah (2.8% of births), reflecting high prevalence rates among Pacific Islander and Asian ethnic groups in Hawaii (24).
Calculated prevalence rates for undiagnosed diabetes and prediabetes show less geographic variation. The prediction equations (based on regression analysis) only take into account variations across states in risk factors such as demographics, obesity and smoking prevalence, prevalence of cardiovascular disease and other biometrics, and a select number of socioeconomic factors such as household income and type of medical insurance. Projected prediabetes prevalence rates ranged from a high of 41.5% of adults in Hawaii to a low of 32.7% in Utah.
Geographic variation in economic burden reflects the variation in disease prevalence, earnings, and cost for medical care. The most populous states of California, Florida, Texas, New York, and Pennsylvania collectively account for 37% of national medical costs associated with diabetes and prediabetes (Table 3).
Conclusions
This study provides estimates of the national economic burden associated with undiagnosed diabetes and prediabetes, and state-level estimates of disease prevalence and economic burden for undiagnosed diabetes, prediabetes, and GDM. Combined with ADA-published estimates of the burden associated with diagnosed diabetes, these figures provide a detailed picture of the economic burden to the nation and individual states associated with prediabetes and diabetes.
In 2012, an estimated 22.3 million people with diagnosed diabetes, 8.1 million with undiagnosed diabetes, 86 million with prediabetes, and 222,000 with GDM contributed to $244 billion in higher medical costs and $78 billion in lost productivity. Nearly half (47.6%) of adults in the U.S. population either have diabetes (10.4%) or are at elevated risk for the development of diabetes (37.2%), with more than three of four adults ≥65 years of age having elevated blood glucose or A1C levels. The 222,000 babies born to mothers with GDM in 2012 represent 5.6% of the nation�s 3.9 million births.
This economic burden of $322 billion in 2012 grew from $218 billion in 2007 ($253 billion in 2012 dollars). After adjusting for general inflation, this burden increased by >5% per year ($13.8 billion annually) due to increasing prevalence of disease and medical costs rising faster than general inflation. The prevalence of diabetes is projected to grow substantially in the coming decades due to population growth, aging, and increasing racial and ethnic diversity, which portends large increases in the associated economic burden (25,26).
Between 2007 and 2012, the national burden grew by 40% for diagnosed diabetes, 82% for undiagnosed diabetes, 74% for prediabetes, and 103% (doubling) for GDM. This comparison illustrates both the growth in disease prevalence associated with a growing and aging population, continued high prevalence of risk factors such as obesity, as well as changes in average cost per case�in part fueled by 11% general inflation and 19% medical inflation over this period. Between 2007 and 2012, diagnosed diabetes prevalence grew 27% (using the 22.3 million estimate for 2012), and the cost per case grew 10% (lower than inflation); undiagnosed diabetes prevalence grew 29%, and the cost per case grew 41%; prediabetes prevalence grew 51%, and the cost per case grew 41%; and GDM prevalence grew 23%, and cost per case grew 65%.
The burden is, of course, disproportionately felt by people with diabetes and their families or caregivers, in addition to the reduced quality of life associated with having diabetes that is not captured in these economic burden estimates. For the 314 million Americans in 2012, this burden represents a hidden �tax,� averaging over $1,000 per person in the form of higher costs for medical insurance (including higher taxes to cover Medicaid and Medicare costs) and reduced national productivity. For a typical American family in 2012 with three members and a median income of $64,000, this diabetes burden equates to 4.8% of income (up from 3.4% in 2007) (2,27).
While prediabetes and GDM constitute only a modest portion of the total economic burden, each year ~1.7-1.9 million new patients receive diagnoses, which suggests that just >2% of the population with prediabetes experiences the onset of diabetes annually (5). Both mothers with GDM and their children are at increased risk for the development of type 2 diabetes (1,9).
Study findings are based on estimates of the extent to which people with diabetes use health care services in excess of a similar demographic portion of the population who do not have diabetes. Estimates of excess expenditures associated with prediabetes and GDM are based on comparisons with, respectively, a population with no diagnosis of prediabetes or births where there was no indication of GDM. Not all cases of diabetes can be prevented, and for those people who experience diabetes onset, not all complications can be prevented. Consequently, the burden estimates presented overstate the medical costs that can actually be prevented. Still, these burden estimates highlight the importance of efforts to prevent or delay the onset of diabetes and sequelae, as well as illustrate how medical costs increase as a person moves from normal blood glucose levels to prediabetes to diabetes.
Study limitations, which have been described in more detail elsewhere (2-4,6,7,10), include the following: 1) undiagnosed diabetes by definition is not identified in medical claims, so we used a proxy population consisting of people who were within 2 years of diagnosis; 2) the regression analyses used to calculate rate ratios using claims data lack controls for potential lifestyle confounders, so additional analyses with MEPS data were conducted, and findings were used to reduce some rate ratios; 3) we used medical claims for a commercially insured population to estimate differences in health care use patterns for prediabetes and undiagnosed diabetes; 4) the study omits the cost of services such as podiatry, some vision care provided by optometrists, and dental care, and omits the indirect costs for mothers with GDM (e.g., increased time off from work) (these omissions could have made the burden estimate more conservative); 5) estimates of the national prevalence of undiagnosed diabetes and prediabetes reported by the CDC and the predictive equations used to generate state-level estimates are based on results for one blood glucose or A1C test (5) (standard clinical practice is to use two blood samples to confirm a diagnosis) (1); 6) patients categorized as having diabetes or prediabetes in medical claims analysis (for which laboratory values are available for some patients) could be based on the presence of a single claim with a diabetes diagnosis code or a single blood glucose or A1C reading (this assumption could produce conservative estimates of the impact of diabetes [or prediabetes] on health care use patterns to the extent that patients without diabetes are inadvertently placed in the wrong category); 7) the use of prediction equations to estimate state-level prevalence of undiagnosed diabetes and prediabetes likely mitigates state-to-state variation in the burden estimates; and 8) burden estimates for prediabetes and undiagnosed diabetes were unavailable for children, so the burden estimates could be conservative with respect to this omission. This is an important area for future research, given the major long-term life course consequences of pediatric diabetes.
The large economic burden associated with diagnosed diabetes (all ages) and undiagnosed diabetes, GDM, and prediabetes (adults) is estimated to be $322 billion in 2012, including $244 billion in higher medical expenditures and $78 billion in reduced productivity. This annual burden exceeds $1,000 for each person in the U.S. The sobering statistics presented in this study underscore the urgency to better understand the cost mitigation potential of prevention and treatment strategies.
|
|
| |
| |
|
|
|