| |
CDC HCV Surveillance 2017: High HCV Mortality
Rates Among 55-74 Age Group & Highest Among Blacks & Latinos
|
| |
| |
Surveillance for Viral Hepatitis - United States, 2017
https://www.cdc.gov/hepatitis/statistics/2017surveillance/index.htm
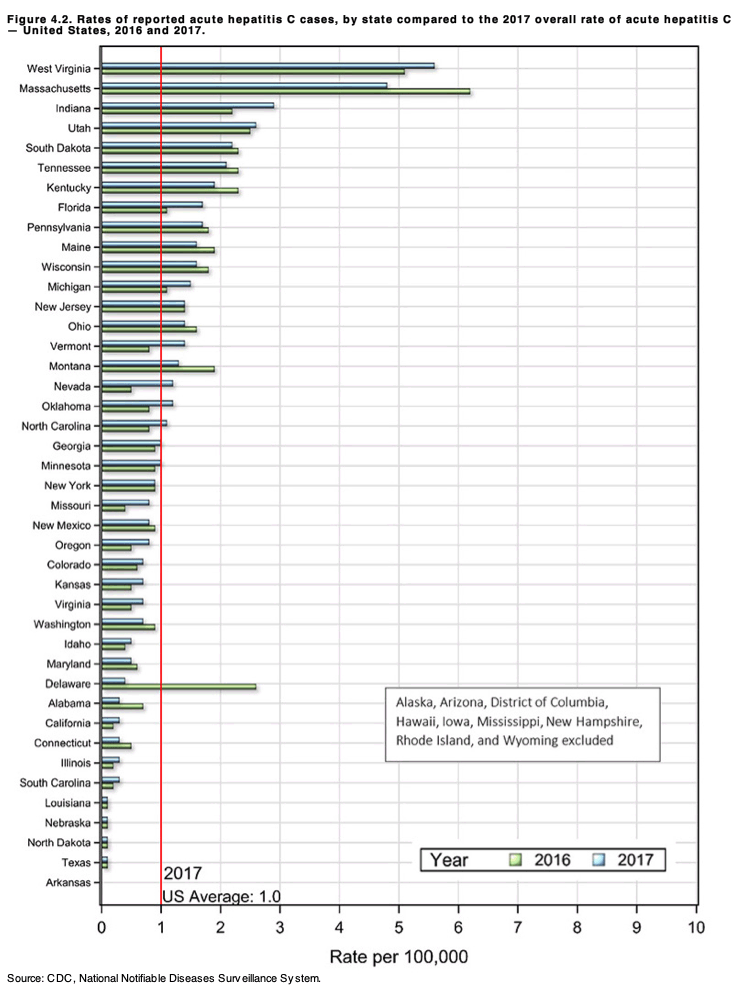
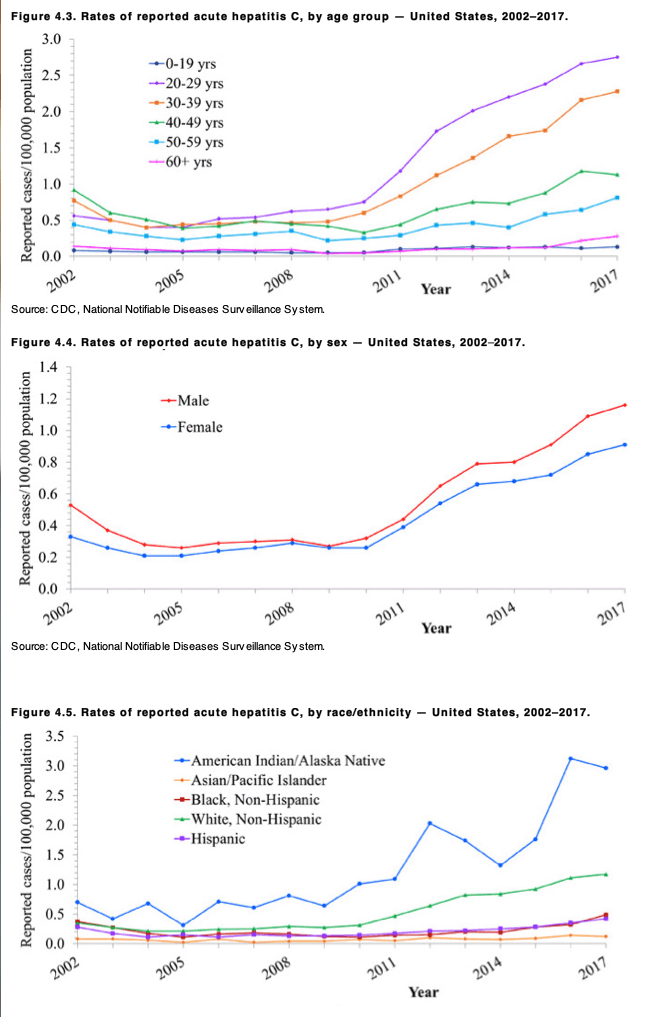
Age groups showed different trends in the number of reported acute hepatitis C cases per 100,000 population:
• Rates rapidly increased for young adults aged 20-29 years and aged 30-39 years from 2009 to 2017. These age groups have been most affected by the nation’s opioid crisis (10).
• For the first time since 2014, adults aged 40-49 years experienced a decrease in infection rates from 2016 to 2017.
• Rates increased among adults aged 50-59 years and aged ≥60 years from 2015 to 2017 to the highest rate reported from 2002 through 2017.
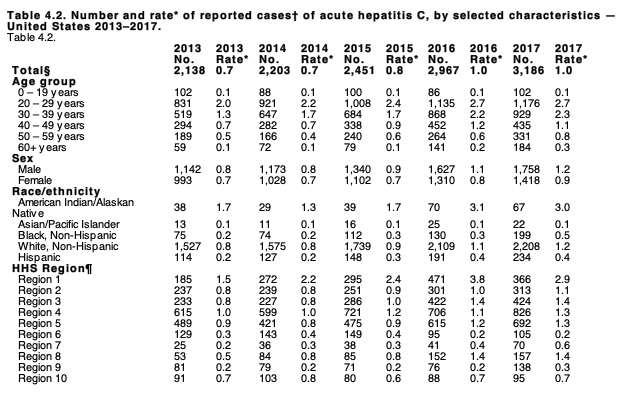
Both males and females experienced an increased rate of reported acute hepatitis C from 2010 to 2017, although the increase for males was more pronounced.
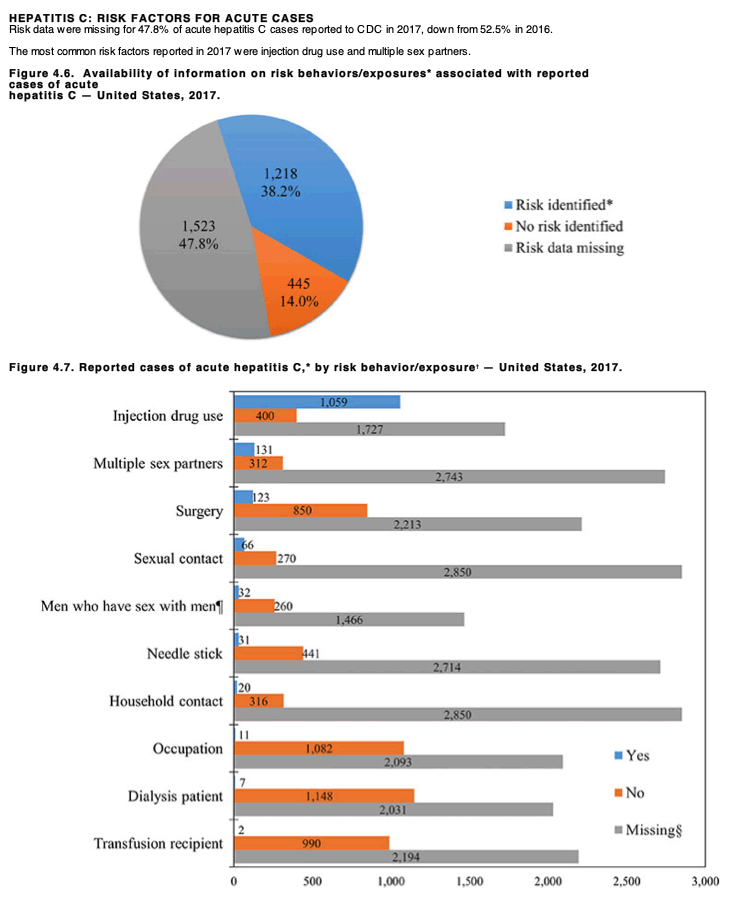
Trends by race/ethnicity revealed the following differences in trends:
• Rates among American Indian/Alaska Natives remain higher than other groups, and the increase since 2010 is more pronounced in this group despite some instability due to the small size of the population.
• Rates among non-Hispanic whites began a marked increase in 2010 that continued through 2017.
• Hispanics and non-Hispanic blacks experienced increases each year from 2014 to 2017.
https://www.cdc.gov/hepatitis/statistics/2017surveillance/index.htm
Entire report in a printable format pdf icon[PDF - 1.8MB - 65 pages]
SUMMARY
Each week, health departments report cases of hepatitis A, hepatitis B, and hepatitis C to the Centers for Disease Control and Prevention (CDC) through the National Notifiable Diseases Surveillance System (NNDSS). CDC aggregates the information to conduct ongoing viral hepatitis surveillance nationwide.
Hepatitis A is an acute infection that can result in mild illness or be severe enough to result in hospitalization or, in rare cases, death. Hepatitis A has been a vaccine preventable disease since the hepatitis A vaccine first became available in 1995. Incidence rates decreased more than 95% from 1995 to 2011, then increased by 140% from 2011 to 2017. Until 2017, US incidence rates were influenced by occasional outbreaks, often linked to imported food, and from time-to-time among non-immune persons. In 2017, large person-to-person outbreaks began occurring among persons who use drugs and persons experiencing homelessness.
Hepatitis B often occurs as an acute infection that may or may not be identified or reported. Later, a chronic infection may develop. Hepatitis B is a vaccine preventable disease and reported cases of acute hepatitis B declined from 1990-2014 after routine vaccination of children was recommended. Injection drug use is a major risk factor associated with acute hepatitis B cases in the US. Chronic hepatitis B infections primarily occur among persons born outside the US in countries with intermediate or high rates of hepatitis B prevalence. Chronic hepatitis B infection can be treated and managed clinically but cannot be cured.
Hepatitis C occurs as an acute infection that is most often asymptomatic and frequently develops into a chronic infection. New cases of acute hepatitis C have increased rapidly in the US since 2010, and have most often been associated with injection drug use. There is no vaccine against hepatitis C, but short-term treatment for chronic hepatitis C can clear the virus and cure the infection.
HEPATITIS C
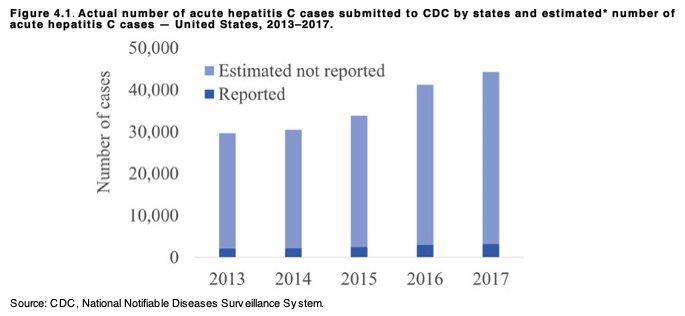
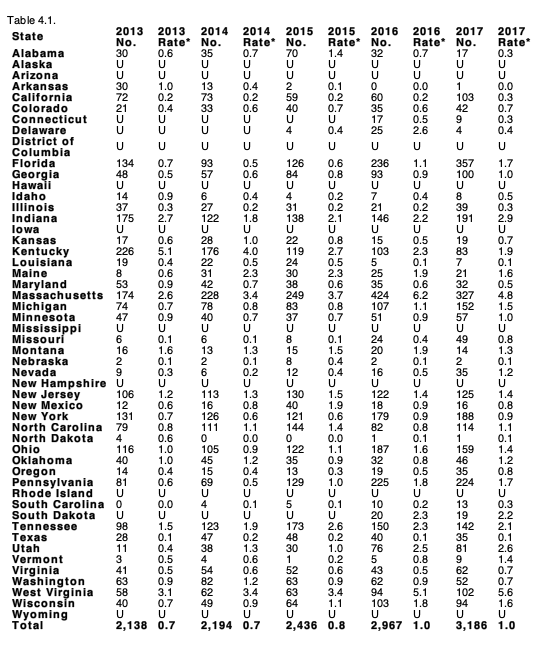
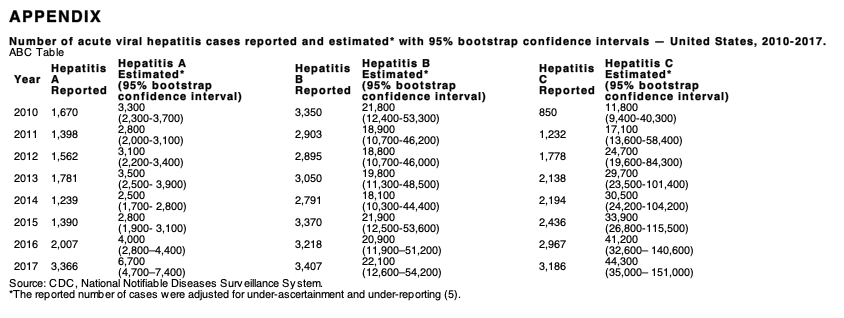
Steady increases in the number of reported acute hepatitis C cases have occurred each year since 2013. This trend is influenced by increasing injection drug use related to the opioid crisis (10) and improved surveillance.
Figure 4.1. Actual number of acute hepatitis C cases submitted to CDC by states and estimated* number of acute hepatitis C cases - United States, 2013-2017.
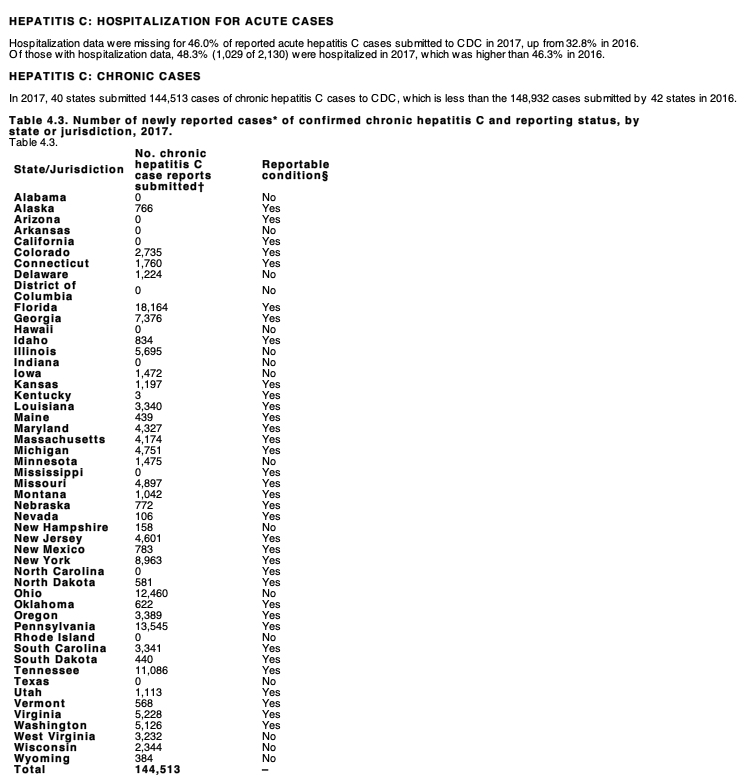
HEPATITIS C: HOSPITALIZATION FOR ACUTE CASES
Hospitalization data were missing for 46.0% of reported acute hepatitis C cases submitted to CDC in 2017, up from 32.8% in 2016.
Of those with hospitalization data, 48.3% (1,029 of 2,130) were hospitalized in 2017, which was higher than 46.3% in 2016.
HEPATITIS C: CHRONIC CASES
In 2017, 40 states submitted 144,513 cases of chronic hepatitis C cases to CDC, which is less than the 148,932 cases submitted by 42 states in 2016.
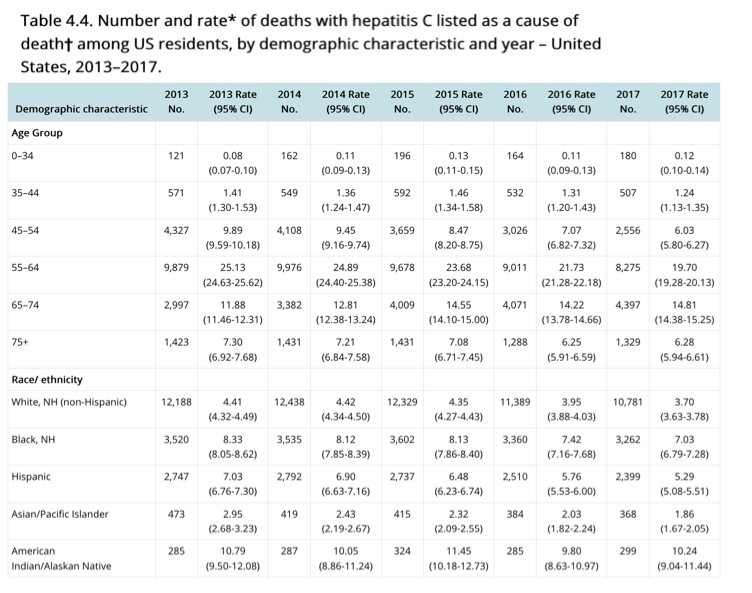
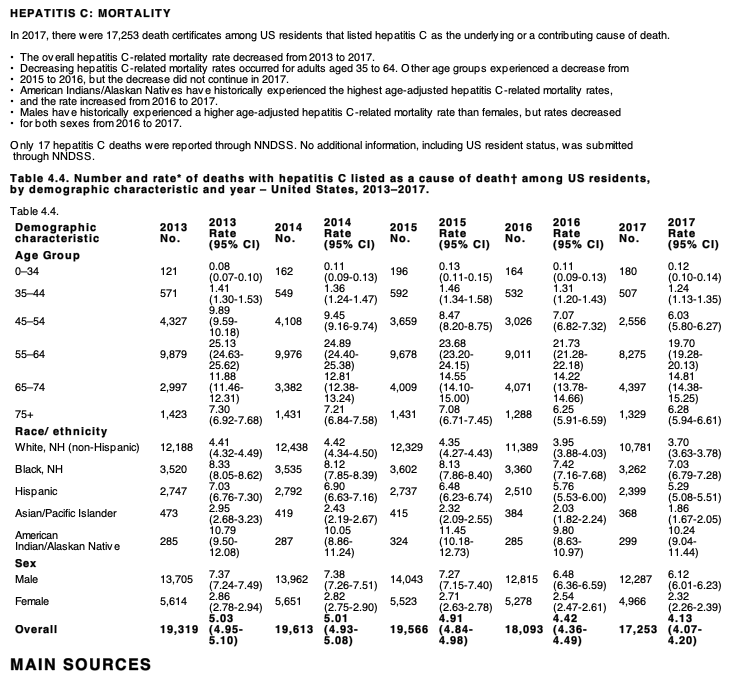
HEPATITIS C: MORTALITY
In 2017, there were 17,253 death certificates among US residents that listed hepatitis C as the underlying or a contributing cause of death.
• The overall hepatitis C-related mortality rate decreased from 2013 to 2017.
• Decreasing hepatitis C-related mortality rates occurred for adults aged 35 to 64. Other age groups experienced a decrease from 2015 to 2016, but the decrease did not continue in 2017.
• American Indians/Alaskan Natives have historically experienced the highest age-adjusted hepatitis C-related mortality rates, and the rate increased from 2016 to 2017.
• Males have historically experienced a higher age-adjusted hepatitis C-related mortality rate than females, but rates decreased for both sexes from 2016 to 2017.
Only 17 hepatitis C deaths were reported through NNDSS. No additional information, including US resident status, was submitted through NNDSS.
1 Centers for Disease Control and Prevention. Hepatitis A Questions and Answers for Health Professionals. Accessed June 11, 2019; Available from: https://www.cdc.gov/hepatitis/hav/havfaq.htm.
2 Doshani, M., et al., Recommendations of the Advisory Committee on Immunization Practices for Use of Hepatitis A Vaccine for Persons Experiencing Homelessness. MMWR Morb Mortal Wkly Rep, 2019. 68(6): p. 153-156. Available from doi: 10.15585/mmwr.mm6806a6.
3 Centers for Disease Control and Prevention. Hepatitis B Questions and Answers for Health Professionals. May 16, 2019, Accessed June 11, 2019; Available from: https://www.cdc.gov/hepatitis/hbv/hbvfaq.htm.
4 Centers for Disease Control and Prevention. Hepatitis C Questions and Answers for Health Professionals. April 9, 2019, Accessed June 11, 2019; Available from: https://www.cdc.gov/hepatitis/hcv/hcvfaq.htm.
5 Klevens, R.M., et al., Estimating acute viral hepatitis infections from nationally reported cases. Am J Public Health, 2014. 104(3): p. 482-7. Available from PubMed Central PMCID PMC3953761external icon.
6 Patel, E.U., et al., Prevalence of Hepatitis B and Hepatitis D Virus Infections in the United States, 2011-2016. Clin Infect Dis, 2019. Available on 2020-01-30 from PubMed Central PMCID PMC6669285external icon.
7 Hofmeister, M.G., et al., Estimating Prevalence of Hepatitis C Virus Infection in the United States, 2013-2016. Hepatology, 2019. 69(3): p. 1020-1031.
8 Foster, M., et al., Hepatitis A Virus Outbreaks Associated with Drug Use and Homelessness – California, Kentucky, Michigan, and Utah, 2017. MMWR Morb Mortal Wkly Rep, 2018. 67(43): p. 1208-1210. Available from PubMed Central PMCID PMC6319801external icon.
9 National Institutes of Health, National Institute on Drug Abuse. Substance Use in Women. July 2018, Accessed June 11, 2019; Available from:
https://www.drugabuse.gov/publications/research-reports/substance-use-in-women/summaryexternal icon.
10 Gomes, T., et al., The Burden of Opioid-Related Mortality in the United States. JAMA Netw Open, 2018. 1(2): p. e180217. Available from PubMed Central PMC6324425external icon.
| |
| |
| |
|
|
|