| |
HIV and the Aging Brain - Miami CFAR Aging Conference
|
| |
| |
Scott Letendre, M.D.
Professor of Medicine & Psychiatry
CFAR HIV & Aging SWG Symposium, Miami
Thursday, December 5, 2019
Download the PDF here
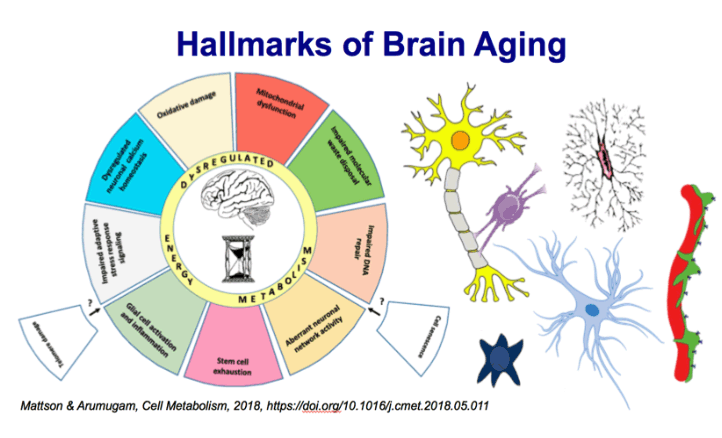
During aging, the cellular milieu of the brain exhibits tell-tale signs of compromised bioenergetics, impaired
adaptive neuroplasticity and resilience, aberrant neuronal network activity, dysregulation of neuronal Ca2+
homeostasis, the accrual of oxidatively modified molecules and organelles, and inflammation. These alterations
render the aging brain vulnerable to Alzheimer's and Parkinson's diseases and stroke. Emerging findings
are revealing mechanisms by which sedentary overindulgent lifestyles accelerate brain aging, whereas
lifestyles that include intermittent bioenergetic challenges (exercise, fasting, and intellectual challenges) foster
healthy brain aging. Here we provide an overview of the cellular and molecular biology of brain aging, how
those processes interface with disease-specific neurodegenerative pathways, and how metabolic states influence brain health.
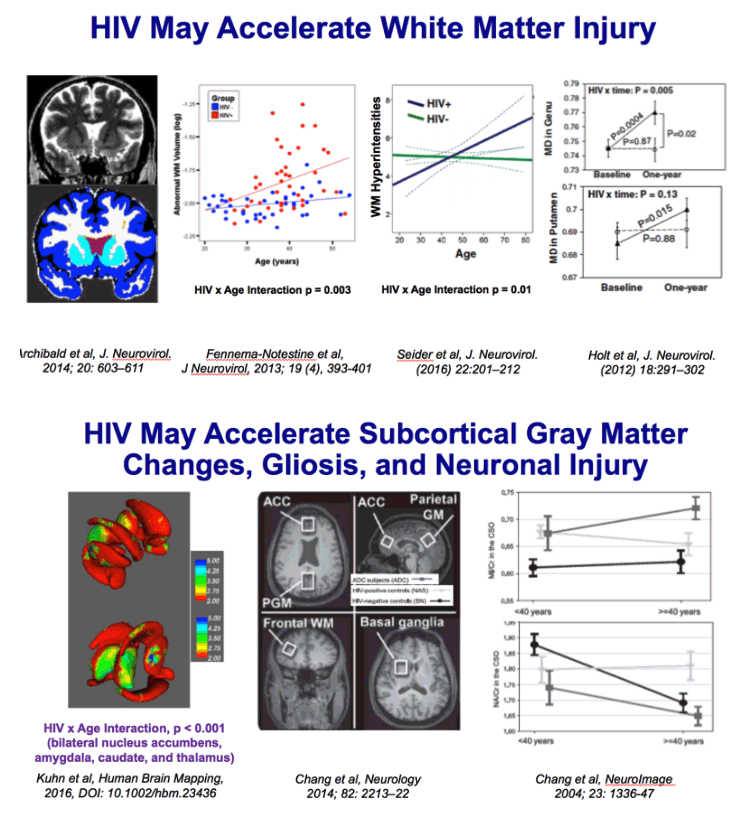
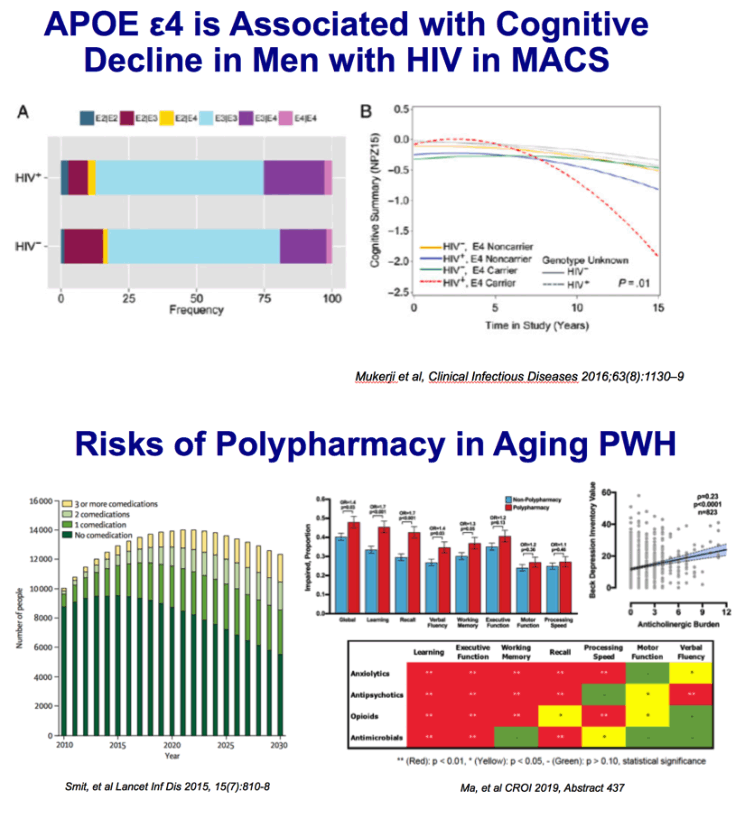
Chang 2014: One hundred seventy-seven participants, primarily of white and mixed race (97 seronegative subjects: aged 44.7 ± 1.3 years, 85 [87.6%] men, 28 [28.9%] APOE ε4+; 80 HIV+ subjects: aged 47.3 ± 1.1 years, 73 [91.3%] men, 23 [28.8%] APOE ε4+), were assessed cross-sectionally for metabolite concentrations using proton magnetic resonance spectroscopy in 4 brain regions and for neuropsychological performance.
Results: Frontal white matter myo-inositol was elevated in subjects with HIV across the age span but showed age-dependent increase in seronegative subjects, especially in APOE ε4+ carriers. In contrast, only seronegative APOE ε4+ subjects showed elevated myo-inositol in parietal cortex. All APOE ε4+ subjects had lower total creatine in basal ganglia. While all HIV subjects showed greater cognitive deficits, HIV+ APOE ε4+ subjects had the poorest executive function, fluency memory, and attention/working memory. Higher myo-inositol levels were associated with poorer fine motor function across all subjects, slower speed of information processing in APOE ε4+ subjects, and worse fluency in HIV+ APOE ε4+ subjects.
Conclusions: In frontal white matter of subjects with HIV, the persistent elevation and lack of normal age-dependent increase in myo-inositol suggest that persistent glial activation attenuated the typical antagonistic pleiotropic effects of APOE ε4 on neuroinflammation. APOE ε4 negatively affects energy metabolism in brain regions rich in dopaminergic synapses. The combined effects of HIV infection and APOE ε4 may lead to greater cognitive deficits, especially in those with greater neuroinflammation. APOEε4 allele(s) may be a useful genetic marker to identify white and mixed-race HIV subjects at risk for cognitive decline.
The NAA peak, at 2.0 ppm, is, perhaps, the most informative spectral feature of all. In normal CNS tissue, it is the highest peak, representing a variety of N-acetyl compounds but chiefly NAA, an amino-acid derivative synthesized almost exclusively in neurons and distributed throughout the cell's dendrites and axon, along which it travels by anterograde axonal transport.30 NAA, therefore, is thought to constitute a specific marker of neuronal viability or, in white matter, a specific marker of axonal integrity.
The presence of elevated levels of mI, a possible indicator of glial cell proliferation or gliosis
The Cr/phosphocreatine peak lies at 3.0 ppm. It represents the high-energy biochemical reserves of neurons and even more so of glia. Because the concentration of Cr arguably is typically stable and unaffected by the disease process, the other metabolites are expressed as a ratio relative to Cr as a means of normalization
The Cho peak, at 3.2 ppm, encompasses several soluble Cho-containing phospholipid constituents of all cell membranes and, hence, of myelin. Because almost all Cho is normally in insoluble form, a heightened Cho peak may represent abnormal Cho mobility, in turn suggesting inflammation, demyelination, and remyelination
Although HIV serostatus and age independently affected fMRI measures, no interaction occurred. Functional brain demands in HIV-positive subjects were equivalent to those of HIV-negative subjects who were 15-20 years older.
The BOLD technique takes advantage of the fact that the change from diamagnetic oxyhemoglobin to paramagnetic deoxyhemoglobin that takes place with brain activation results in decreased signal intensity on MRI.
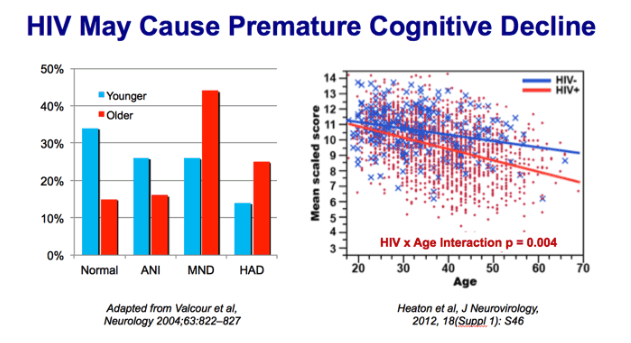
two groups of the Hawaii Ageing with HIV Cohort: older (50 or more years old, n=106) and younger (20 to 39 years old, n=96). After adjusting for education, race, substance dependence, antiretroviral medication status, viral load, CD4 lymphocyte count, and Beck Depression Inventory score, the odds of having HAD among individuals in the older group was 3.26 (1.32 to 8.07) times that of the younger group
CHARTER: 1521 HIV+ and 273 HIV- persons. HIV+ performed systematically worse than HIV- in the domains of learning, memory, speed of information processing, verbal-language skills, working memory, executive functions, motor skills, and a summary scale score (all p's less than 0.01). Of specific relevance to this application, there were significant age x HIV interactions for the domains of speed of information processing, learning and memory, executive functions, motor skills, and the summary scale for all tests (all p's <0.05; see Figure 1a for example based on summary performance: age x group interaction p= 0.004).
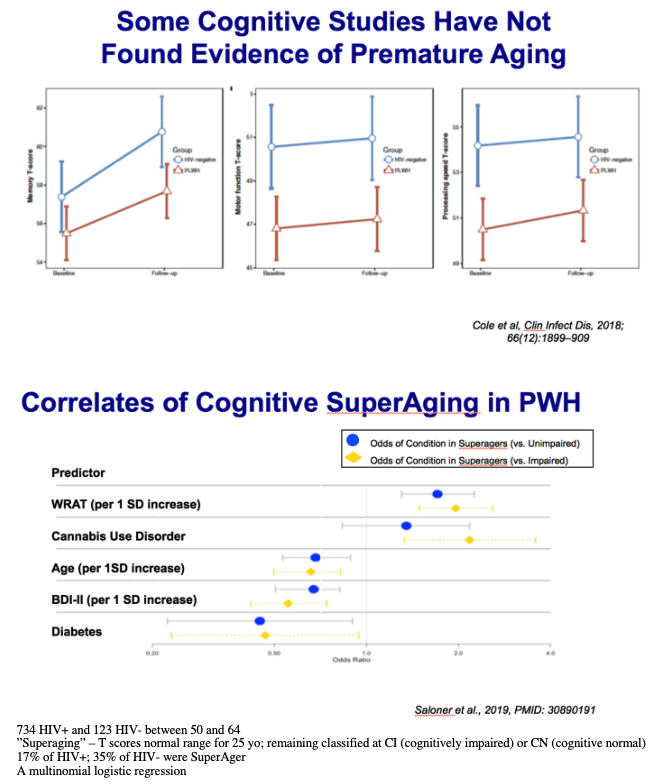
734 HIV+ and 123 HIV- between 50 and 64
"Superaging" - T scores normal range for 25 yo; remaining classified at CI (cognitively impaired) or CN (cognitive normal)
17% of HIV+; 35% of HIV- were SuperAger
A multinomial logistic regression
Likelihood ratio tests indicated that older age, lower WRAT scores, diagnosis of diabetes, and higher BDI-II scores all increased the likelihood of classification as either CN or CI compared to SA (Table 4).
CUD-> SA (40%), CN (35%), CI (26%) [SA > CI]
A lifetime diagnosis of cannabis use disorder decreased the likelihood of classification as CI compared to SA.
To focus on a clinically relevant subgroup, we reran the multinomial logistic regression among participants with undetectable levels of HIV plasma RNA. Age, WRAT, BDI-II, and diagnosis of lifetime cannabis use disorder remained significant predictors of neurocognitive status in this virally suppressed subgroup.
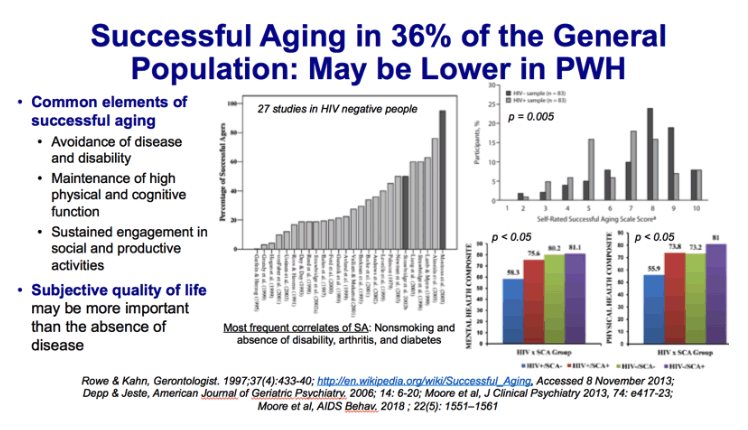
Of the 27 studies that included categorical operationalized definitions, mean sample size-weighted proportion of successful agers was 35.8% (SD: 19.8, median: 34.0) (Figure 1). The range of proportion of successful agers varied greatly, from 0.4% to 95%. The interquartile range was 31% (19%-50%). The proportion of successful agers was inversely rated to the minimum age criterion of the study samples (ranging from age 60-85; r-0.526, p 0.001) and the number of components in the definitions (ranging from 1-6, r0.726, p 0.001). Blue bars represent self-rated (SR) successful aging.
The authors identified 28 studies with 29 different definitions that met our criteria. Most investigations used large samples of community-dwelling older adults. The mean reported proportion of successful agers was 35.8% (standard deviation: 19.8) but varied widely (interquartile range: 31%). Multiple components of these definitions were identified, although 26 of 29 included disability/physical functioning. The most frequent significant correlates of the various definitions of successful aging were age (young-old), nonsmoking, and absence of disability, arthritis, and diabetes. Moderate support was found for greater physical activity, more social contacts, better self-rated health, absence of depression and cognitive impairment, and fewer medical conditions. Gender, income, education, and marital status generally did not relate to successful aging.
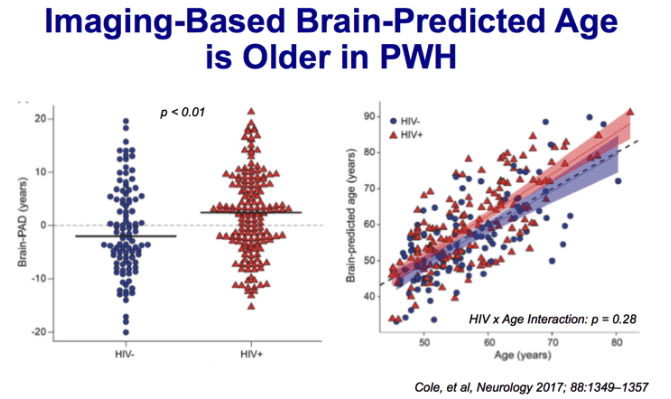
Methods: A large sample of virologically suppressed HIV-positive adults (n 5 162, age 45-82
years) and highly comparable HIV-negative controls (n 5 105) were recruited as part of the Comorbidity
in Relation to AIDS (COBRA) collaboration. Using T1-weighted MRI scans, a machinelearning
model of healthy brain aging was defined in an independent cohort (n 5 2,001, aged 18-
90 years). Neuroimaging data from HIV-positive and HIV-negative individuals were then used to
estimate brain-predicted age; then brain-predicted age difference (brain-PAD 5 brain-predicted
brain age 2 chronological age) scores were calculated. Neuropsychological and clinical assessments
were also carried out.
Results:HIV-positive individuals had greater brain-PAD score (mean 6 SD 2.15 6 7.79 years)
compared to HIV-negative individuals (20.87 6 8.40 years; b 5 3.48, p , 0.01). Increased brain-
PAD score was associated with decreased performance in multiple cognitive domains (information
processing speed, executive function, memory) and general cognitive performance across all
participants. Brain-PAD score was not associated with age, duration of HIV infection, or other
HIV-related measures.
Conclusion: Increased apparent brain aging, predicted using neuroimaging, was observed in
HIV-positive adults, despite effective viral suppression. Furthermore, the magnitude of increased
apparent brain aging related to cognitive deficits. However, predicted brain age difference did not
correlate with chronological age or duration of HIV infection, suggesting that HIV disease may
accentuate rather than accelerate brain aging. Neurology 2017;88:1349-1357
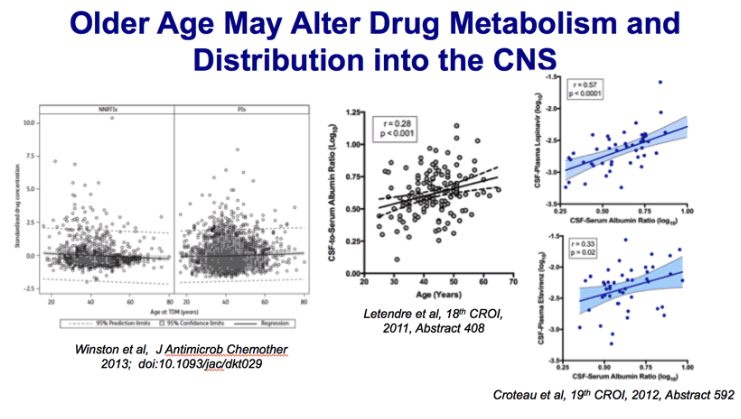
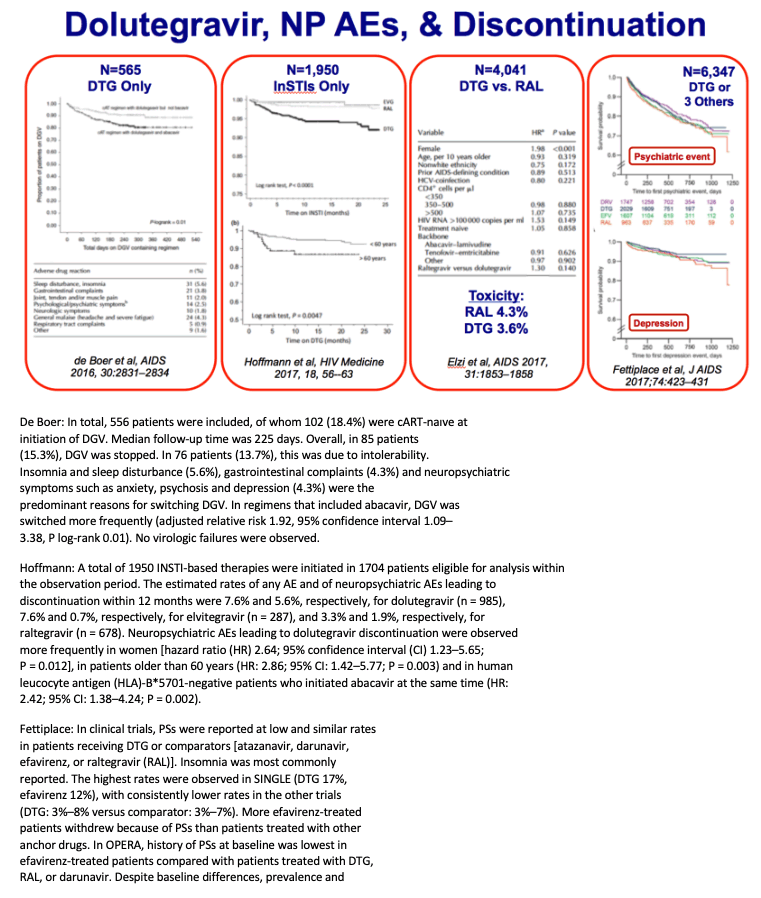
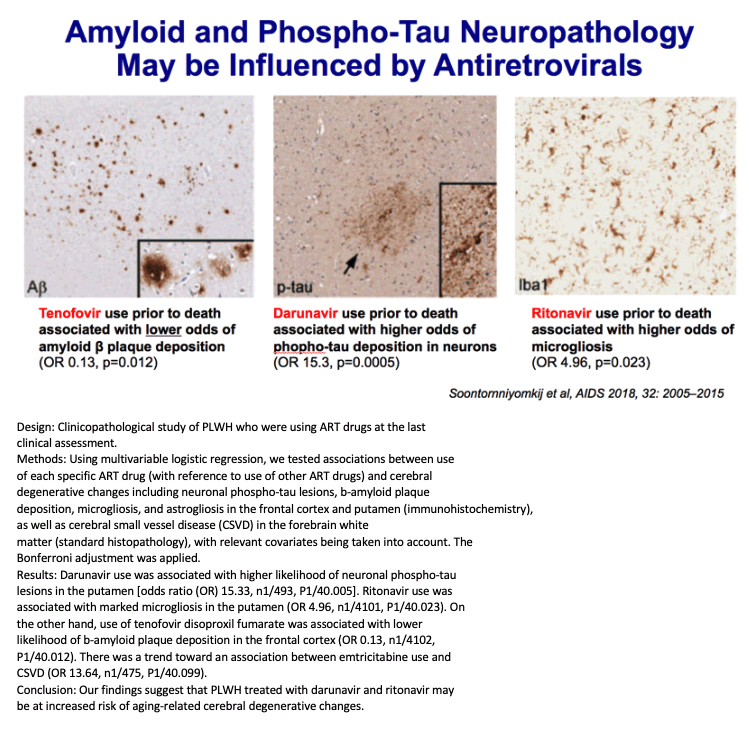
Methods: Data from the Liverpool TDM Registry were linked with the UK Collaborative HIV Cohort (CHIC) Study.
All TDM of protease inhibitors (PIs) and non-nucleoside reverse transcriptase inhibitors (NNRTIs) was included
and in order to account for different antiretroviral drugs the plasma concentrations were standardized by group
measurements according to drug, dosing and timing of TDM. Regression modelling was used to evaluate associations
of drug exposure with age and clinical parameters, including hepatic transaminase results and time to
antiretroviral treatment modification.
Results: Data from 3589 TDM samples were available from 2447 subjects. The greatest numbers of plasma
concentrations were assessed for lopinavir (22.4%), efavirenz (18.5%), atazanavir (17.0%) and saquinavir
(11.6%). As age increased, median standardized NNRTI concentrations remained constant, whereas PI concentrations
increased (correlation coefficient 0.04, P.0.033). In a regression analysis stratified by antiretroviral
drug class, standardized plasma concentrations were significantly associated with age for PIs (0.05 increase
in standard deviation of drug concentration with each 10 year increase in age, P.0.044), but not for NNRTIs
or other clinical parameters, including hepatic transaminase results or time to antiretroviral treatment modification.
Conclusions:With increasing age, statistically significant rises in plasma PI exposure, but not NNRTI exposure,
were observed. The clinical relevance of this observation merits further investigation.
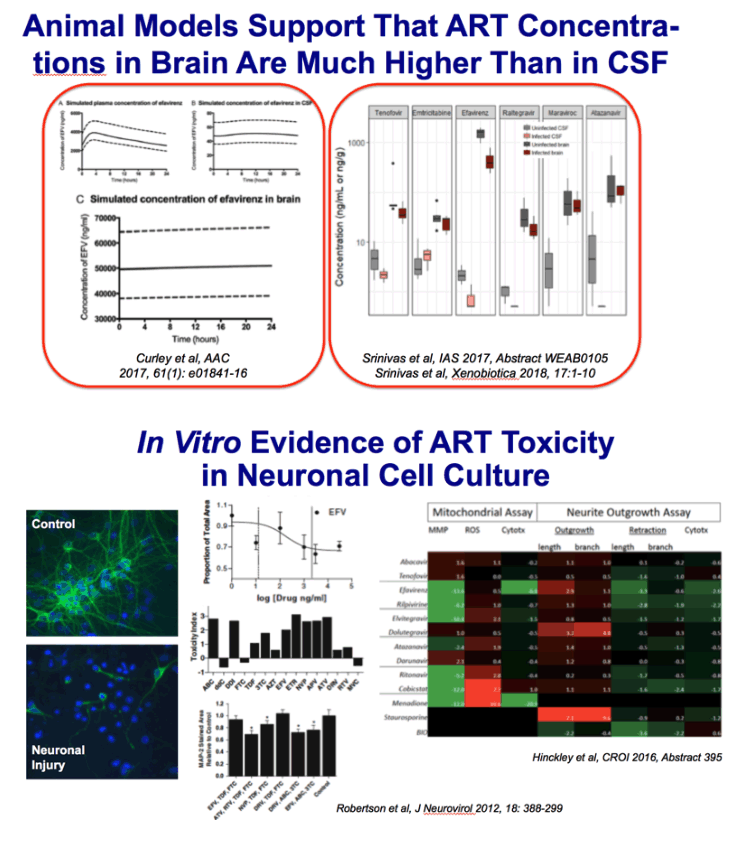
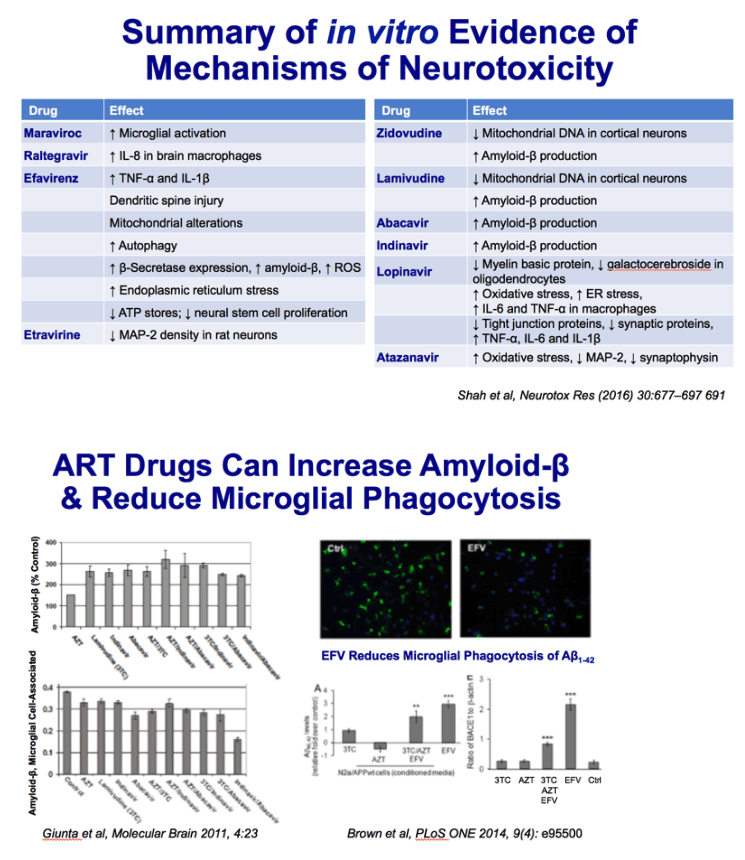
Despite effective viral suppression through combined antiretroviral
therapy (cART), approximately half of HIV-positive individuals
have HIV-associated neurocognitive disorders (HAND). Studies of
antiretroviral-treated patients have revealed persistent white matter
abnormalities including diffuse myelin pallor, diminished white matter
tracts, and decreased myelin protein mRNAs. Loss of myelin can
contribute to neurocognitive dysfunction because the myelin membrane
generated by oligodendrocytes is essential for rapid signal transduction
and axonal maintenance. We hypothesized that myelin
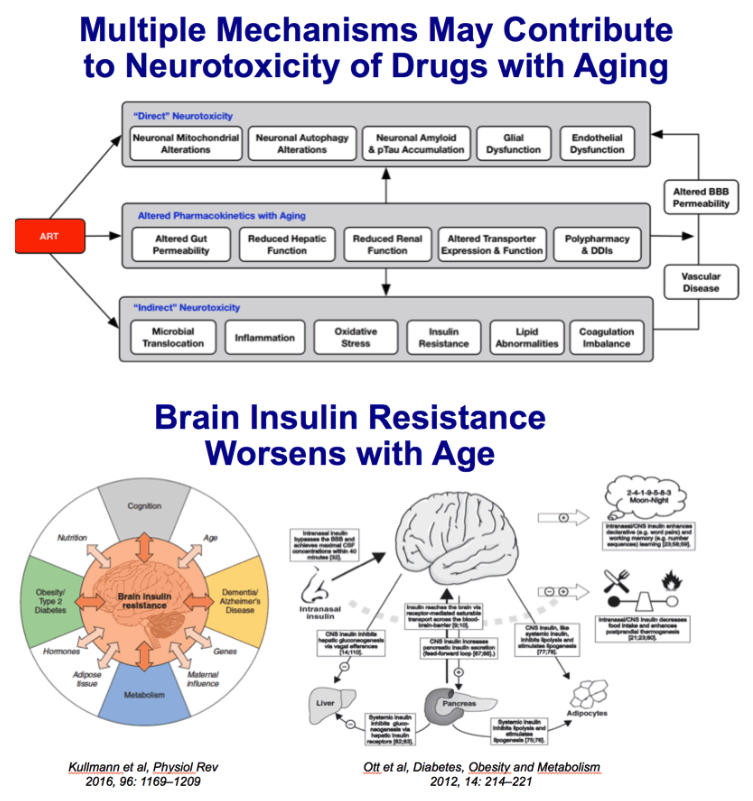
changes in HAND are partly due to effects of antiretroviral drugs on
oligodendrocyte survival and/or maturation. We showed that primary
mouse oligodendrocyte precursor cell cultures treated with therapeutic
concentrations of HIV protease inhibitors ritonavir or lopinavir
displayed dose-dependent decreases in oligodendrocyte maturation;
however, this effect was rapidly reversed after drug removal. Conversely,
nucleoside reverse transcriptase inhibitor zidovudine had no
effect. Furthermore, in vivo ritonavir administration to adult mice
reduced frontal cortex myelin protein levels. Finally, prefrontal cortex
tissue from HIV-positive individuals with HAND on cART showed a
significant decrease in myelin basic protein compared with untreated
HIV-positive individuals with HAND or HIV-negative controls.
These findings demonstrate that antiretrovirals can impact myelin integrity
and have implications for myelination in juvenile HIV patients
and myelin maintenance in adults on lifelong therapy.
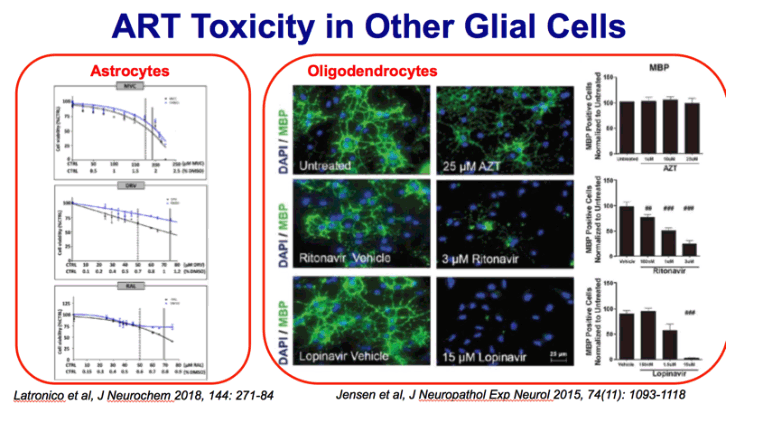
FIGURE 1. Antiretrovirals inhibit oligodendrocyte differentiation. Primary mouse oligodendrocyte precursor cells (OPCs) plated on
coverslips were put into differentiation medium and treated with vehicle (DMSO), doses of zidovudine (AZT) (1, 10, or 25 μM),
ritonavir (100 nM, 1 μM, or 3 μM), or lopinavir (150 nM, 1.5 μM, or 15 μM). After 72 hours, cells were fixed and stained with
antibody to myelin basic protein (MBP, green) with DAPI (blue) for total cell nuclei. Epifluorescent images were captured, with 10
fields on 3 coverslips per condition. Results from n = 4 independently prepared cultures. (A) Representative images from
immunofluorescence staining; scale bar indicates 25 μm. (B, C) Immature oligodendrocytes (galactocerebroside [GalC]-positive
cells) (B) and mature oligodendrocytes (MBP-positive cells) (C) were counted using ImageJ software, represented as percentage
normalized to untreated.
myelin basic protein (MBP) (A-C), cyclic-nucleotide-3'phosphodiesterase (CNP) (D), or proteolipid
protein (PLP)
CNPase is the earliest
myelin protein to be expressed during maturation (41), and our
observation may reflect a remyelination attempt that is prematurely
halted, failing to form mature myelin.
(B) Individuals satisfying criteria for HAND diagnosis were stratified by HIV-treatment status.
Black lines indicate mean ± SE. One-way ANOVA followed by post hoc Newman-Keuls determined statistical significance
(#p < 0.05; ###p < 0.001).
CNPase is a myelin-associated enzyme that makes up 4% of total CNS myelin protein, and is thought to undergo significant age-associated changes.[7] It is named for its ability to catalyze the phosphodiester hydrolysis of 2',3'-cyclic nucleotides to 2'-nucleotides, though a cohesive understanding of its specific physiologic functions are still ambiguous.[8]
Structural studies have revealed that four classes of CNPases belong to one protein superfamily. CNPase's catalytic core consists of three alpha-helices and nine beta-strands. The proposed mechanism of CNPases phosphodiesterase catalytic activity is similar to the second step of the reaction mechanism for RNase A.[9]
CNPase is expressed exclusively by oligodendrocytes in the CNS, and the appearance of CNPase seems to be one of the earliest events of oligodendrocyte differentiation.[10] CNPase is thought to play a critical role in the events leading up to myelination.[11]
CNPase also associates with microtubules in brain tissue and FRTL-5 thyroid cells, and is reported to have microtubule-associated protein-like activity (MAP; see MAP2), being able to catalyze microtubule formation at low molar ratios. Deletion of the C-terminus of CNPase or phosphorylation abolish the catalytic activity of microtubule formation. CNPase can link tubulin to cellular membranes, and might be involved in the regulation cytoplasmic microtubule distribution.[12]
CNNPase has also been demonstrated to inhibit the replication of HIV-1 and other primate lentiviruses by binding the retroviral Gag protein and inhibiting the genesis of nascent viral particles. Whether this is a biological function of CNPase or a coincidental activity remains unclear.[13]
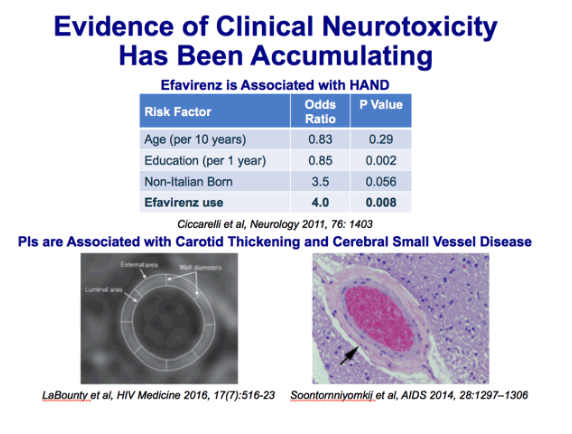
Results. CYP2B6 516GrT was identified in the *6 allele (found in 17.9% of our subjects) and a novel allele,*26 (found in 1.3% of our patients). All EFV-treated CYP2B6 *6/*6 and *6/*26 carriers had extremely high plasma
EFV concentrations (16000 ng/mL) while receiving the standard dosage. EFV dose was reduced to 400 mg for 11 patients and to 200 mg for 7 patients with persistently suppressed HIV-1 loads. EFV-containing treatment was initiated at 400 mg in 4 CYP2B6 *6/*6 carriers and one *6/*26 carrier. Two of them still had a high plasma EFV concentration while receiving that dose, and the dose was further reduced to 200 mg, with successful HIV-1 suppression. CNS-related symptoms improved with dose reduction in 10 of the 14 patients, although some had not been aware of the symptoms at initial dosage.
Improvement of CNS symptoms. As described above, the EFV dose was reduced from 600 to 400 and 200 mg as the final dose in 5 and 7 subjects, respectively (figure 4), and it was decreased from 400 mg as the initial dose to 200 mg for 2 other subjects (figure 5). To delineate the changes in CNS symptoms associated with the decrease in EFV concentration, a questionnaire survey of these 14 patients was conducted regarding 6 items: dizziness, strange dreams, depression, irritability, concentration problems, and sleep difficulty. More than 1 month after the dose had been reduced to the lowest dose, the patients were asked to judge the 6 CNS symptoms above at initial and final doses, with use of a 5-grade system ("none,""slight," "sometimes," "often," and "always"). Ten (71%) of the 14 patients had some of the aforementioned CNS symptoms during treatment with the initial dose (table 2). The most common symptom was dizziness (57%), followed by strange dreams (50%). Interestingly, all the symptoms improved after dose reduction in the 10 patients. Furthermore, dizziness and concentration
problems disappeared during treatment with the final dose in one-half of the patients, although strange dreams
and sleep difficulty were still reported by all the patients who had those difficulties at the initial dose. Finally, when the patients
were asked whether they wanted to reincrease EFV to the previous dose, all 10 patients with CNS symptoms at the
initial dose answered "no" (9 answered "absolutely no").
|
|
| |
| |
|
|
|