 |
|
|
| |
BICTEGRAVIR and DOLUTEGRAVIR have no impact on glucose levels 12 months after initiation
|
| |
| |

purpose
Dolutegravir (DTG) and Raltegravir have been associated in vitro and in vivo with increased Insulin Resistance. Our aim was to explore the impact of DTG and Bictegravir (BIC) on glucose levels in a real-life cohort.
method
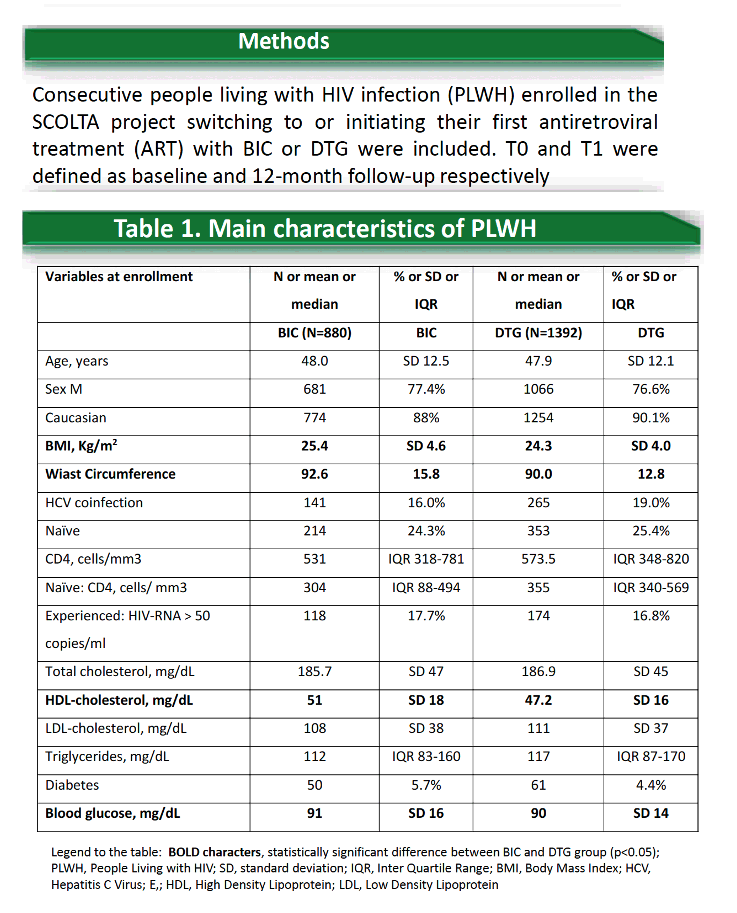
Consecutive people living with HIV infection (PLWH) enrolled in the SCOLTA project switching to or initiating their first antiretroviral treatment (ART) with BIC or DTG were included. T0 and T1 were defined as baseline and 12-month follow-up respectively.
results
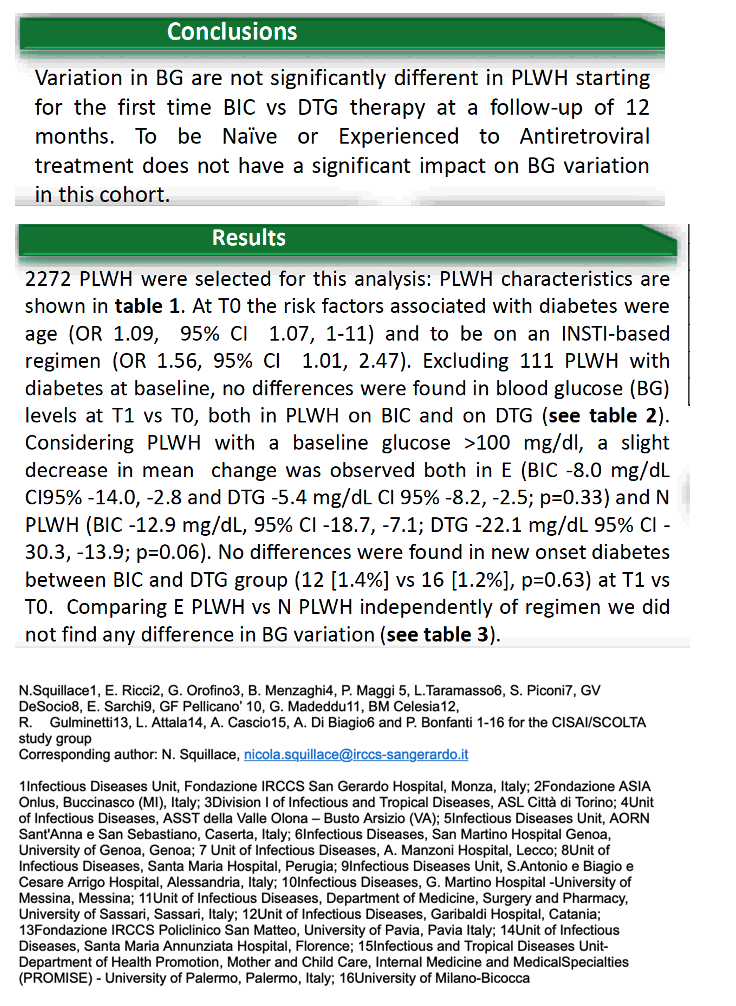
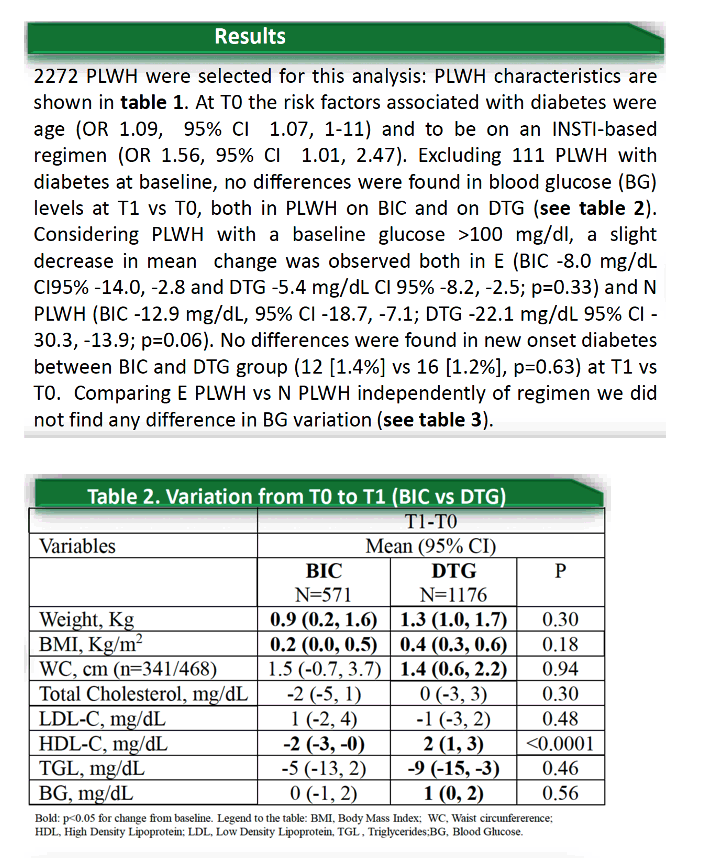
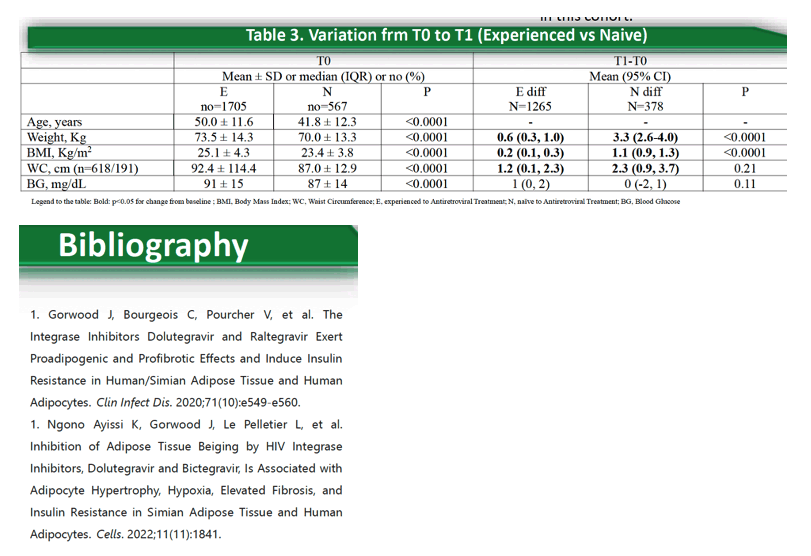
2272 PLWH were selected for this analysis: 880 (666 ART experienced [EXP]) initiated BIC and 1392 (1039 EXP) DTG. PLWH characteristics are shown in table 1. Table 1 Main characteristics (2272 PLWH) Variables at enrollment N or mean or median % or SD or IQR N or mean or median % or SD or IQR BICTEGRAVIR (880 PLWH)DOLUTEGRAVIR (1392 PLWH)Age, years 48.0 SD 12.5 47.9 SD 12.1 Male sex681 77.4% 1066 76.6% Caucasian 774 88% 1254 90.1% BMI, Kg/m2 25.4 SD 4.6 24.3 SD 4.0 HCV coinfection 141 16.0% 265 19.0% Naïve 214 24.3% 353 25.4% CD4, cells/mm3 531 IQR 318-781 573.5 IQR 348-820 Naïve: CD4, cells/ mm3 304 IQR 88-494 355 IQR 340-569 EXP: HIV-RNA > 50 copies/ml 118 17.7% 174 16.8% Total cholesterol, mg/dL 185.7 SD 47 186.9 SD 45 HDL-cholesterol, mg/dL 51 SD 19 47.2 SD 16 LDL-cholesterol, mg/dL 108 SD 38 111 SD 37 Triglycerides, mg/dL 112 IQR 83-160 117 IQR 87-170 Diabetes 50 5.7% 61 4.4% Blood glucose, mg/dL (Non-diabetic PLWH) 91SD 16 90 SD 14 Blood glucose > 100 mg/dL (Non-diabetic PLWH) 144 17.4% 218 16.4% Legend to the table: PLWH, People Living with HIV; SD, standard deviation; IQR, Inter Quartile Range; BMI, Body Mass Index; HCV, Hepatitis C Virus; EXP, Experienced to Antiretroviral Treatment; HDL, High Density Lipoprotein; LDL, Low Density Lipoprotein At T0 the risk factors associated with diabetes were age (OR 1.09, 95% CI 1.07, 1-11) and to be on an INSTI-based regimen (OR 1.56, 95% CI 1.01, 2.47). Excluding 111 PLWH with diabetes at baseline, no differences were found in glucose levels at T1 vs T0, both in EXP PLWH (BIC -0.5 mg/dL, 95% CI -2.7, 1.7 and DTG 1.0 mg/dL, 95% CI -0.5, 2. 5; p=0.26) and in Naïve PLWH (BIC 0.6 mg/dL, 95% CI -3.8, 5.0 and DTG -0.9 mg/dL, 95% CI -3.0, 1.3; p=0.52). Considering PLWH with a baseline glucose >100 mg/dl, a slight decrease in mean glucose change was observed both in EXP (BIC -8.0 mg/dL CI 95% -14.0, -2.8 and DTG -5.4 mg/dL CI 95% -8.2, -2.5; p=0.33) and naïve PLWH (BIC -12.9 mg/dL, 95% CI -18.7, -7.1; DTG -22.1 mg/dL 95% CI -30.3, -13.9; p=0.06). We did not find any correlation between glucose and BMI variation. No differences were found in new onset diabetes between BIC and DTG group (12 [1.4%] vs 16 [1.2%], p=0.63) at T1 vs T0.
conclusions
DTG and BIC showed a good impact on glucose levels at 12 months since initiation. No difference was observed in development of new onset diabetes.
|
| |
|
|
|
|
|